Quest Diagnostics 2011 Annual Report Download - page 68
Download and view the complete annual report
Please find page 68 of the 2011 Quest Diagnostics annual report below. You can navigate through the pages in the report by either clicking on the pages listed below, or by using the keyword search tool below to find specific information within the annual report.-
 1
1 -
2
-
3
-
4
-
5
-
6
-
7
-
8
-
9
-
10
-
11
-
12
-
13
-
14
-
15
-
16
-
17
-
18
-
19
-
20
-
21
-
22
-
23
-
24
-
25
-
26
-
27
-
28
-
29
-
30
-
31
-
32
-
33
-
34
-
35
-
36
-
37
-
38
-
39
-
40
-
41
-
42
-
43
-
44
-
45
-
46
-
47
-
48
-
49
-
50
-
51
-
52
-
53
-
54
-
55
-
56
-
57
-
 58
58 -
 59
59 -
 60
60 -
 61
61 -
 62
62 -
 63
63 -
 64
64 -
 65
65 -
 66
66 -
 67
67 -
 68
68 -
 69
69 -
 70
70 -
 71
71 -
 72
72 -
 73
73 -
 74
74 -
 75
75 -
 76
76 -
 77
77 -
 78
78 -
79
-
80
-
81
-
82
-
83
-
84
-
85
-
86
-
87
-
88
-
89
-
90
-
91
-
92
-
93
-
94
-
95
-
96
-
97
-
98
-
99
-
100
-
101
-
102
-
103
-
104
-
105
-
106
-
107
-
108
-
109
-
110
-
111
-
112
-
113
-
114
-
115
-
116
-
117
-
118
-
119
-
120
-
121
-
122
-
123
 |
 |
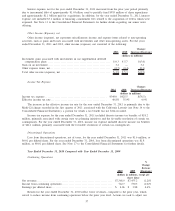
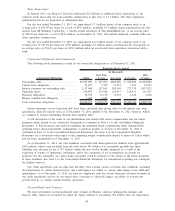
exposed to price fluctuations and are generally concentrated in the life sciences industry. The carrying values of
our available-for-sale equity securities and privately held securities were $12.2 million at December 31, 2011.
We regularly evaluate the fair value measurements of our equity investments to determine if losses in value
are other than temporary and if an impairment loss has been incurred. The evaluation considers if the security
has the ability to recover and, if so, the estimated recovery period. Other factors that are considered in this
evaluation include the amount of the other-than-temporary decline and its duration, the issuer’s financial condition
and short-term prospects, and whether the market decline was caused by overall economic conditions or
conditions specific to the individual security.
We do not hedge our equity price risk. The impact of an adverse movement in equity prices on our holdings
in privately held companies cannot be easily quantified, as our ability to realize returns on investments depends
on, among other things, the enterprises’ ability to raise additional capital or derive cash inflows from continuing
operations or through liquidity events such as initial public offerings, mergers or private sales.
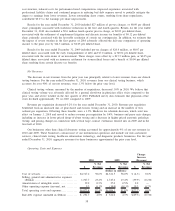
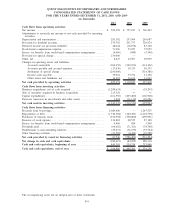
Liquidity and Capital Resources
Cash and Cash Equivalents
Cash and cash equivalents at December 31, 2011 totaled $165 million, compared to $449 million at
December 31, 2010. Cash and cash equivalents consist of cash and highly liquid short-term investments. For the
year ended December 31, 2011, cash flows from operating activities of $895 million, together with cash on hand
and cash flows from financing activities of $64 million, were used to fund investing activities of $1.2 billion.
Cash and cash equivalents at December 31, 2010 totaled $449 million compared to $534 million at December 31,
2009. For the year ended December 31, 2010, cash flows from operating activities of $1.1 billion, together with
cash on-hand, were used to fund investing and financing activities of $217 million and $986 million, respectively.
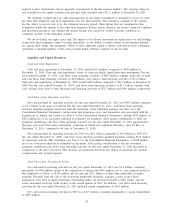
Cash Flows from Operating Activities
Net cash provided by operating activities for the year ended December 31, 2011 was $895 million compared
to $1.1 billion in the prior year period. For the year ended December 31, 2011, cash flows from operating
activities included payments associated with the settlement of the California Lawsuit (see Note 16 to the
Consolidated Financial Statements), restructuring and integration costs, and transaction costs associated with the
acquisitions of Athena and Celera (see Note 4 to the Consolidated Financial Statements) totaling $320 million, or
$202 million net of an associated reduction in estimated tax payments. After giving consideration to these net
payments, underlying cash flows from operating activities for the year ended December 31, 2011 approximated
the prior year level. Days sales outstanding, a measure of billing and collection efficiency, were 45 days at
December 31, 2011, compared to 44 days at December 31, 2010.
Net cash provided by operating activities for 2010 was $1.1 billion compared to $1.0 billion in 2009. For
the year ended December 31, 2009, cash flows from operating activities included payments totaling $314 million
in connection with the NID settlement (see Note 17 to the Consolidated Financial Statements), or $208 million
net of an associated reduction in estimated tax payments. After giving consideration to the net settlement
payments, underlying cash flows from operating activities for the year ended December 31, 2010 decreased in
comparison to the prior year level. This decrease was primarily driven by the timing of payments for variable
compensation and accrued expenses.
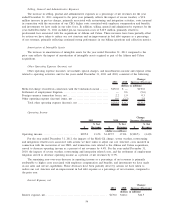
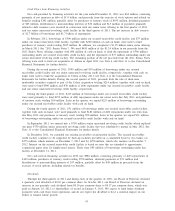
Cash Flows from Investing Activities
Net cash used in investing activities for the year ended December 31, 2011 was $1.2 billion, consisting
principally of $740 million related to the acquisition of Athena and $556 million, net of cash acquired related to
the acquisition of Celera, or $343 million, net of cash and $213 million of short-term marketable securities
acquired. Proceeds from the sale of the short-term marketable securities, acquired as part of the Celera
acquisition, were used to repay borrowings outstanding under our secured receivables credit facility and our
senior unsecured revolving credit facility in the second quarter of 2011. In addition, cash flows from investing
activities for the year ended December 31, 2011 included capital expenditures of $162 million.
Net cash used in investing activities in 2010 was $217 million, consisting principally of capital expenditures
of $205 million.
62