Quest Diagnostics 2011 Annual Report Download - page 54
Download and view the complete annual report
Please find page 54 of the 2011 Quest Diagnostics annual report below. You can navigate through the pages in the report by either clicking on the pages listed below, or by using the keyword search tool below to find specific information within the annual report.-
 1
1 -
2
-
3
-
4
-
5
-
6
-
7
-
8
-
9
-
10
-
11
-
12
-
13
-
14
-
15
-
16
-
17
-
18
-
19
-
20
-
21
-
22
-
23
-
24
-
25
-
26
-
27
-
28
-
29
-
30
-
31
-
32
-
33
-
34
-
35
-
36
-
37
-
38
-
39
-
40
-
41
-
42
-
43
-
 44
44 -
 45
45 -
 46
46 -
 47
47 -
 48
48 -
 49
49 -
 50
50 -
 51
51 -
 52
52 -
 53
53 -
 54
54 -
 55
55 -
 56
56 -
 57
57 -
 58
58 -
 59
59 -
 60
60 -
 61
61 -
 62
62 -
 63
63 -
 64
64 -
65
-
66
-
67
-
68
-
69
-
70
-
71
-
72
-
73
-
74
-
75
-
76
-
77
-
78
-
79
-
80
-
81
-
82
-
83
-
84
-
85
-
86
-
87
-
88
-
89
-
90
-
91
-
92
-
93
-
94
-
95
-
96
-
97
-
98
-
99
-
100
-
101
-
102
-
103
-
104
-
105
-
106
-
107
-
108
-
109
-
110
-
111
-
112
-
113
-
114
-
115
-
116
-
117
-
118
-
119
-
120
-
121
-
122
-
123
 |
 |
best practices and developing additional initiatives designed to further improve quality and the efficiency of our
operations.
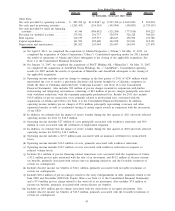
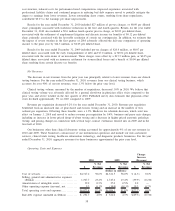
The diagnostic testing industry is labor intensive. Employee compensation and benefits constitute
approximately one-half of our total costs and expenses. Cost of services consists principally of costs for
obtaining, transporting and testing specimens. Selling, general and administrative expenses consist principally of
the costs associated with our sales and marketing efforts, billing operations, bad debt expense, and general
management and administrative support. In addition, performing diagnostic testing involves significant fixed costs
for facilities and other infrastructure required to obtain, transport and test specimens. Therefore, relatively small
changes in volume can have a significant impact on profitability in the short-term.
Since a large portion of our costs are fixed, it is more challenging to fully mitigate the profit impact of
reduced volume in the short term. In response to reduced volume levels, as a result of a temporary slowdown in
healthcare utilization, we have implemented a number of actions in 2011 to align our costs with reduced volume
levels. These actions, which are broad in nature and affect most parts of our business, along with other
restructuring and integration activities, resulted in charges to earnings in 2011 totaling $52 million, which
included $42 million of pre-tax charges, principally associated with workforce reductions; with the remainder
principally professional fees.
In addition, in July 2011 we announced a multi-year program designed to reduce our cost structure by $500
million by the end of 2014. This effort is intended to address continued reimbursement pressures and labor and
benefit cost increases, free up additional resources to invest in science and innovation, and enable us to improve
operating profitability. We expect to realize meaningful benefits from this program in 2012, with the bulk of the
savings in 2013 and 2014. We anticipate roughly one-third of the savings from client support/billing, procurement
and supply chain; one-third from laboratory operations and specimen acquisition; and one-third from selling,
general and administrative expenses, including information technology. Common themes across many of the
opportunities include standardizing systems and processes and data bases, increased use of automation and
technology, and centralizing and selective outsourcing of certain activities. As detailed plans to implement these
opportunities are approved and executed, it likely will result in charges to earnings associated with the
implementation. These charges may be material to the results of operations and cash flows in the periods
recorded or paid.
Shareholder Focus
We are focused on increasing shareholder returns and returns on invested capital (“ROIC”) through a
framework that encompasses improving operating performance and disciplined capital deployment. To improve
our operating performance, we are taking steps to accelerate organic revenue growth and to reduce our operating
costs. As noted above, we have launched a program to reduce our operating costs by $500 million by the end of
2014.
Our disciplined capital deployment framework includes dividends, share repurchases and investment in our
business and is intended to improve ROIC. The framework is grounded in maintaining an investment grade credit
rating. In 2012, we expect to use the majority of our free cash flow to reduce our outstanding debt and achieve a
debt/EBITDA ratio in the range of 2–2
1
⁄
4
times. Upon achieving our targeted leverage ratio, we expect to return
to investors through a combination of dividends and share repurchases a majority of our free cash flow.
Consistent with that expectation, we increased our quarterly common stock dividend by 70%, from $0.10 per
share to $0.17 per share, in January 2012. We expect that the dividend will grow over time commensurate with
earnings and cash flows.
We will continue to invest in our business in a disciplined manner which should require significantly less
capital than in recent years. As a result of our 2011 acquisitions of Athena Diagnostics and Celera, we believe
that we have established a solid foundation of strategic assets and capabilities, and that it is unlikely that we will
complete any large strategic acquisitions in the near term. Our near-term investments are likely to focus on
smaller fold-in acquisitions; investments in science and innovation in the form of licensing, collaborations and
internal development; and investments in technology that will improve quality and efficiency in our laboratories
and in other parts of our business. We anticipate that selective acquisitions will enable us to add capabilities and
further strengthen our access and distribution.
48