Quest Diagnostics 2011 Annual Report Download - page 113
Download and view the complete annual report
Please find page 113 of the 2011 Quest Diagnostics annual report below. You can navigate through the pages in the report by either clicking on the pages listed below, or by using the keyword search tool below to find specific information within the annual report.-
 1
1 -
2
-
3
-
4
-
5
-
6
-
7
-
8
-
9
-
10
-
11
-
12
-
13
-
14
-
15
-
16
-
17
-
18
-
19
-
20
-
21
-
22
-
23
-
24
-
25
-
26
-
27
-
28
-
29
-
30
-
31
-
32
-
33
-
34
-
35
-
36
-
37
-
38
-
39
-
40
-
41
-
42
-
43
-
44
-
45
-
46
-
47
-
48
-
49
-
50
-
51
-
52
-
53
-
54
-
55
-
56
-
57
-
58
-
59
-
60
-
61
-
62
-
63
-
64
-
65
-
66
-
67
-
68
-
69
-
70
-
71
-
72
-
73
-
74
-
75
-
76
-
77
-
78
-
79
-
80
-
81
-
82
-
83
-
84
-
85
-
86
-
87
-
88
-
89
-
90
-
91
-
92
-
93
-
94
-
95
-
96
-
97
-
98
-
99
-
100
-
101
-
102
-
 103
103 -
 104
104 -
 105
105 -
 106
106 -
 107
107 -
 108
108 -
 109
109 -
 110
110 -
 111
111 -
 112
112 -
 113
113 -
 114
114 -
 115
115 -
 116
116 -
 117
117 -
 118
118 -
 119
119 -
 120
120 -
 121
121 -
 122
122 -
 123
123
 |
 |

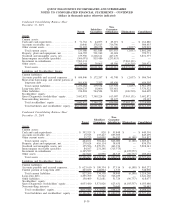
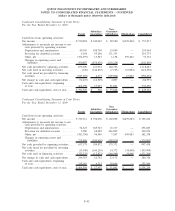
Condensed Consolidating Statement of Operations
For the Year Ended December 31, 2009
Parent
Subsidiary
Guarantors
Non-
Guarantor
Subsidiaries Eliminations Consolidated
Net revenues ................................ $ 877,940 $6,140,346 $767,481 $(330,524) $7,455,243
Operating costs and expenses:
Cost of services........................... 518,958 3,550,414 252,103 — 4,321,475
Selling, general and administrative ......... 171,724 1,232,366 373,542 (30,014) 1,747,618
Amortization of intangible assets........... 72 30,218 6,772 — 37,062
Royalty (income) expense . . . .............. (405,393) 405,393 — — —
Other operating (income) expense, net ..... (13,017) (521) 3,515 — (10,023)
Total operating costs and expenses . ..... 272,344 5,217,870 635,932 (30,014) 6,096,132
Operating income ........................... 605,596 922,476 131,549 (300,510) 1,359,111
Non-operating (expense) income, net ......... (172,522) (274,924) 15,757 300,510 (131,179)
Income from continuing operations before
taxes ..................................... 433,074 647,552 147,306 — 1,227,932
Income tax expense . . ....................... 163,846 252,220 44,408 — 460,474
Income from continuing operations ........... 269,228 395,332 102,898 — 767,458
Loss from discontinued operations, net of
taxes ..................................... — (1,236) — — (1,236)
Equity earnings from subsidiaries ............ 459,883 — — (459,883) —
Net income ................................. 729,111 394,096 102,898 (459,883) 766,222
Less: Net income attributable to
noncontrolling interests .................... — — 37,111 — 37,111
Net income attributable to Quest
Diagnostics ............................... $ 729,111 $ 394,096 $ 65,787 $(459,883) $ 729,111
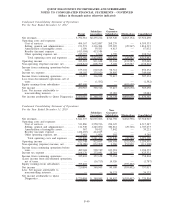
Condensed Consolidating Statement of Cash Flows
For the Year Ended December 31, 2011
Parent
Subsidiary
Guarantors
Non-
Guarantor
Subsidiaries Eliminations Consolidated
Cash flows from operating activities:
Net income ............................... $ 470,567 $ 365,316 $ 73,417 $(403,650) $ 505,650
Adjustments to reconcile net income to net
cash provided by operating activities:
Depreciation and amortization............ 45,120 219,476 16,506 — 281,102
Provision for doubtful accounts . . . ....... 5,306 57,924 216,362 — 279,592
Provision for special charge.............. 236,000 — — — 236,000
Other, net............................... (390,503) 87,699 3,845 403,650 104,691
Changes in operating assets and
liabilities . . . .......................... 34,580 (323,505) (222,636) — (511,561)
Net cash provided by operating activities . . . 401,070 406,910 87,494 — 895,474
Net cash used in investing activities . ....... (1,205,686) (225,503) (13,504) 201,258 (1,243,435)
Net cash provided by (used in) financing
activities ................................ 483,853 (138,282) (80,767) (201,258) 63,546
Net change in cash and cash equivalents.... (320,763) 43,125 (6,777) — (284,415)
Cash and cash equivalents, beginning
of year ................................. 392,525 928 55,848 — 449,301
Cash and cash equivalents, end of year ..... $ 71,762 $ 44,053 $ 49,071 $ — $ 164,886
F-41
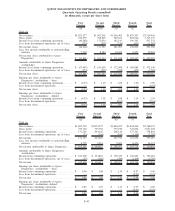
QUEST DIAGNOSTICS INCORPORATED AND SUBSIDIARIES
NOTES TO CONSOLIDATED FINANCIAL STATEMENTS - CONTINUED
(dollars in thousands unless otherwise indicated)