Quest Diagnostics 2011 Annual Report Download - page 112
Download and view the complete annual report
Please find page 112 of the 2011 Quest Diagnostics annual report below. You can navigate through the pages in the report by either clicking on the pages listed below, or by using the keyword search tool below to find specific information within the annual report.-
 1
1 -
2
-
3
-
4
-
5
-
6
-
7
-
8
-
9
-
10
-
11
-
12
-
13
-
14
-
15
-
16
-
17
-
18
-
19
-
20
-
21
-
22
-
23
-
24
-
25
-
26
-
27
-
28
-
29
-
30
-
31
-
32
-
33
-
34
-
35
-
36
-
37
-
38
-
39
-
40
-
41
-
42
-
43
-
44
-
45
-
46
-
47
-
48
-
49
-
50
-
51
-
52
-
53
-
54
-
55
-
56
-
57
-
58
-
59
-
60
-
61
-
62
-
63
-
64
-
65
-
66
-
67
-
68
-
69
-
70
-
71
-
72
-
73
-
74
-
75
-
76
-
77
-
78
-
79
-
80
-
81
-
82
-
83
-
84
-
85
-
86
-
87
-
88
-
89
-
90
-
91
-
92
-
93
-
94
-
95
-
96
-
97
-
98
-
99
-
100
-
101
-
 102
102 -
 103
103 -
 104
104 -
 105
105 -
 106
106 -
 107
107 -
 108
108 -
 109
109 -
 110
110 -
 111
111 -
 112
112 -
 113
113 -
 114
114 -
 115
115 -
 116
116 -
 117
117 -
 118
118 -
 119
119 -
 120
120 -
 121
121 -
 122
122 -
123
 |
 |

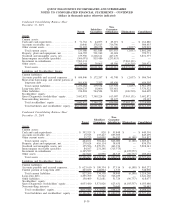
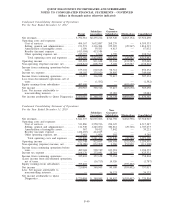
Condensed Consolidating Statement of Operations
For the Year Ended December 31, 2011
Parent
Subsidiary
Guarantors
Non-
Guarantor
Subsidiaries Eliminations Consolidated
Net revenues ................................ $ 792,912 $6,235,212 $745,520 $(263,154) $7,510,490
Operating costs and expenses:
Cost of services........................... 494,167 3,632,887 268,279 — 4,395,333
Selling, general and administrative ......... 151,573 1,316,384 375,925 (29,567) 1,814,315
Amortization of intangible assets........... 1,036 59,583 6,413 — 67,032
Royalty (income) expense . . . .............. (413,584) 413,584 — — —
Other operating expense, net. .............. 235,797 1,166 1,799 — 238,762
Total operating costs and expenses . ..... 468,989 5,423,604 652,416 (29,567) 6,515,442
Operating income ........................... 323,923 811,608 93,104 (233,587) 995,048
Non-operating (expense) income, net ......... (168,821) (208,790) 5,208 233,587 (138,816)
Income from continuing operations before
taxes ..................................... 155,102 602,818 98,312 — 856,232
Income tax expense . . ....................... 88,185 235,920 24,895 — 349,000
Income from continuing operations ........... 66,917 366,898 73,417 — 507,232
Loss from discontinued operations, net of
taxes ..................................... — (1,582) — — (1,582)
Equity earnings from subsidiaries ............ 403,650 — — (403,650) —
Net income ................................. 470,567 365,316 73,417 (403,650) 505,650
Less: Net income attributable to
noncontrolling interests .................... — — 35,083 — 35,083
Net income attributable to Quest Diagnostics . $ 470,567 $ 365,316 $ 38,334 $(403,650) $ 470,567
Condensed Consolidating Statement of Operations
For the Year Ended December 31, 2010
Parent
Subsidiary
Guarantors
Non-
Guarantor
Subsidiaries Eliminations Consolidated
Net revenues ................................ $ 841,637 $6,065,086 $744,798 $(282,596) $7,368,925
Operating costs and expenses:
Cost of services........................... 511,886 3,550,726 254,635 — 4,317,247
Selling, general and administrative ......... 111,530 1,245,050 380,861 (29,768) 1,707,673
Amortization of intangible assets........... 967 30,412 7,842 — 39,221
Royalty (income) expense . . . .............. (414,185) 414,185 — — —
Other operating expense, net. .............. 7,691 1,056 502 — 9,249
Total operating costs and expenses . ..... 217,889 5,241,429 643,840 (29,768) 6,073,390
Operating income ........................... 623,748 823,657 100,958 (252,828) 1,295,535
Non-operating (expense) income, net ......... (134,080) (232,908) 2,960 252,828 (111,200)
Income from continuing operations before
taxes ..................................... 489,668 590,749 103,918 — 1,184,335
Income tax expense . . ....................... 164,176 233,091 28,264 — 425,531
Income from continuing operations ........... 325,492 357,658 75,654 — 758,804
(Loss) income from discontinued operations,
net of taxes............................... — (16,713) 14,926 — (1,787)
Equity earnings from subsidiaries ............ 395,402 — — (395,402) —
Net income ................................. 720,894 340,945 90,580 (395,402) 757,017
Less: Net income attributable to
noncontrolling interests .................... — — 36,123 — 36,123
Net income attributable to Quest
Diagnostics ............................... $ 720,894 $ 340,945 $ 54,457 $(395,402) $ 720,894
F-40
QUEST DIAGNOSTICS INCORPORATED AND SUBSIDIARIES
NOTES TO CONSOLIDATED FINANCIAL STATEMENTS - CONTINUED
(dollars in thousands unless otherwise indicated)