Quest Diagnostics 2011 Annual Report Download - page 67
Download and view the complete annual report
Please find page 67 of the 2011 Quest Diagnostics annual report below. You can navigate through the pages in the report by either clicking on the pages listed below, or by using the keyword search tool below to find specific information within the annual report.-
 1
1 -
2
-
3
-
4
-
5
-
6
-
7
-
8
-
9
-
10
-
11
-
12
-
13
-
14
-
15
-
16
-
17
-
18
-
19
-
20
-
21
-
22
-
23
-
24
-
25
-
26
-
27
-
28
-
29
-
30
-
31
-
32
-
33
-
34
-
35
-
36
-
37
-
38
-
39
-
40
-
41
-
42
-
43
-
44
-
45
-
46
-
47
-
48
-
49
-
50
-
51
-
52
-
53
-
54
-
55
-
56
-
 57
57 -
 58
58 -
 59
59 -
 60
60 -
 61
61 -
 62
62 -
 63
63 -
 64
64 -
 65
65 -
 66
66 -
 67
67 -
 68
68 -
 69
69 -
 70
70 -
 71
71 -
 72
72 -
 73
73 -
 74
74 -
 75
75 -
 76
76 -
 77
77 -
78
-
79
-
80
-
81
-
82
-
83
-
84
-
85
-
86
-
87
-
88
-
89
-
90
-
91
-
92
-
93
-
94
-
95
-
96
-
97
-
98
-
99
-
100
-
101
-
102
-
103
-
104
-
105
-
106
-
107
-
108
-
109
-
110
-
111
-
112
-
113
-
114
-
115
-
116
-
117
-
118
-
119
-
120
-
121
-
122
-
123
 |
 |
million, which had been previously reserved in connection with the final settlement. See Note 17 to the
Consolidated Financial Statements for further details.
Quantitative and Qualitative Disclosures About Market Risk
We address our exposure to market risks, principally the market risk of changes in interest rates, through a
controlled program of risk management that includes the use of derivative financial instruments. We do not hold
or issue derivative financial instruments for speculative purposes. We believe that our exposures to foreign
exchange impacts and changes in commodities prices are not material to our consolidated financial condition or
results of operations. See Note 12 to the Consolidated Financial Statements for additional discussion of our
financial instruments and hedging activities.
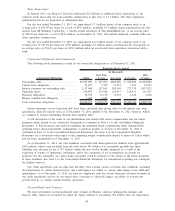
At December 31, 2011 and 2010, the fair value of our debt was estimated at approximately $4.4 billion and
$3.1 billion, respectively, using quoted market prices and yields for the same or similar types of borrowings,
taking into account the underlying terms of the debt instruments. At December 31, 2011 and 2010, the estimated
fair value exceeded the carrying value of the debt by $387 million and $80 million, respectively. A hypothetical
10% increase in interest rates (representing 41 basis points and 45 basis points at December 31, 2011 and 2010,
respectively) would potentially reduce the estimated fair value of our debt by approximately $112 million and
$89 million at December 31, 2011 and 2010, respectively.
Borrowings under our floating rate senior notes due 2014, our term loan due May 2012, our senior
unsecured revolving credit facility and our secured receivables credit facility are subject to variable interest rates.
Interest on our secured receivables credit facility is based on rates that are intended to approximate commercial
paper rates for highly-rated issuers. Interest on our term loan due May 2012 and our senior unsecured revolving
credit facility are subject to a pricing schedule that can fluctuate based on changes in our credit ratings. As such,
our borrowing cost under these credit arrangements will be subject to both fluctuations in interest rates and
changes in our credit ratings. At December 31, 2011, the borrowing rates under these debt instruments were: for
our floating rate senior notes due 2014, LIBOR plus 0.85%; for our term loan due May 2012, LIBOR plus
0.40%; for our senior unsecured revolving credit facility, LIBOR plus 1.125%; and for our secured receivables
credit facility, 1.0%. At December 31, 2011, the weighted average LIBOR was 0.4%. As of December 31, 2011,
$200 million, $560 million, and $85 million were outstanding under our floating rate senior notes due 2014, our
term loan due May 2012, and our $525 million secured receivables credit facility, respectively. There were no
borrowings outstanding under our $750 million senior unsecured revolving credit facility as of December 31,
2011.
We seek to mitigate the variability in cash outflows that result from changes in interest rates by maintaining
a balanced mix of fixed-rate and variable-rate debt obligations. In order to achieve this objective, we have
entered into interest rate swaps. Interest rate swaps involve the periodic exchange of payments without the
exchange of underlying principal or notional amounts. Net settlements are recognized as an adjustment to interest
expense.
In March 2011, we entered into various fixed-to-variable interest rate swap agreements which have a
notional amount totaling $200 million and a variable interest rate based on six-month LIBOR plus 0.54%. These
derivative financial instruments are accounted for as fair value hedges of a portion of our senior notes due 2016.
In addition, in previous years we entered into various fixed-to-variable interest rate swap agreements with a
notional amount of $350 million and a variable interest rate based on one-month LIBOR plus 1.33% that were
accounted for as fair value hedges of a portion of our senior notes due 2020. Based on our net exposure to
interest rate changes, a hypothetical 10% change in interest rates on our variable rate indebtedness (representing 4
basis points) would impact annual interest expense by approximately $0.6 million, assuming no changes to the
debt outstanding at December 31, 2011.
The fair value of the fixed-to-variable interest rate swap agreements related to our senior notes due 2016 and
our senior notes due 2020 was an asset of $56.5 million at December 31, 2011. A hypothetical 10% change in
interest rates (representing 15 basis points) would potentially change the fair value of the asset by approximately
$5 million.
For details regarding our outstanding debt and our financial instruments, see Notes 11 and 12 to the
Consolidated Financial Statements.
Risk Associated with Investment Portfolio
Our investment portfolio includes equity investments in publicly held companies that are classified as
available-for-sale securities and other strategic equity holdings in privately held companies. These securities are
61