Quest Diagnostics 2011 Annual Report Download - page 114
Download and view the complete annual report
Please find page 114 of the 2011 Quest Diagnostics annual report below. You can navigate through the pages in the report by either clicking on the pages listed below, or by using the keyword search tool below to find specific information within the annual report.-
 1
1 -
2
-
3
-
4
-
5
-
6
-
7
-
8
-
9
-
10
-
11
-
12
-
13
-
14
-
15
-
16
-
17
-
18
-
19
-
20
-
21
-
22
-
23
-
24
-
25
-
26
-
27
-
28
-
29
-
30
-
31
-
32
-
33
-
34
-
35
-
36
-
37
-
38
-
39
-
40
-
41
-
42
-
43
-
44
-
45
-
46
-
47
-
48
-
49
-
50
-
51
-
52
-
53
-
54
-
55
-
56
-
57
-
58
-
59
-
60
-
61
-
62
-
63
-
64
-
65
-
66
-
67
-
68
-
69
-
70
-
71
-
72
-
73
-
74
-
75
-
76
-
77
-
78
-
79
-
80
-
81
-
82
-
83
-
84
-
85
-
86
-
87
-
88
-
89
-
90
-
91
-
92
-
93
-
94
-
95
-
96
-
97
-
98
-
99
-
100
-
101
-
102
-
103
-
 104
104 -
 105
105 -
 106
106 -
 107
107 -
 108
108 -
 109
109 -
 110
110 -
 111
111 -
 112
112 -
 113
113 -
 114
114 -
 115
115 -
 116
116 -
 117
117 -
 118
118 -
 119
119 -
 120
120 -
 121
121 -
 122
122 -
 123
123
 |
 |

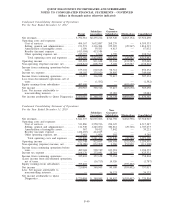
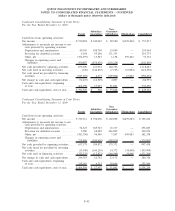
Condensed Consolidating Statement of Cash Flows
For the Year Ended December 31, 2010
Parent
Subsidiary
Guarantors
Non-
Guarantor
Subsidiaries Eliminations Consolidated
Cash flows from operating activities:
Net income ................................. $ 720,894 $ 340,945 $ 90,580 $(395,402) $ 757,017
Adjustments to reconcile net income to net
cash provided by operating activities:
Depreciation and amortization ............. 49,310 188,705 15,949 — 253,964
Provision for doubtful accounts ............ 5,164 55,240 231,333 — 291,737
Other, net ................................ (352,975) 13,547 1,158 395,402 57,132
Changes in operating assets and
liabilities ............................... 450,897 (474,476) (218,224) — (241,803)
Net cash provided by operating activities ..... 873,290 123,961 120,796 — 1,118,047
Net cash used in investing activities.......... (120) (144,863) (7,725) (63,802) (216,510)
Net cash (used in) provided by financing
activities. ................................. (945,603) 4,373 (109,064) 63,802 (986,492)
Net change in cash and cash equivalents ..... (72,433) (16,529) 4,007 — (84,955)
Cash and cash equivalents, beginning
of year . . ................................. 464,958 17,457 51,841 — 534,256
Cash and cash equivalents, end of year. ...... $ 392,525 $ 928 $ 55,848 $ — $ 449,301
Condensed Consolidating Statement of Cash Flows
For the Year Ended December 31, 2009
Parent
Subsidiary
Guarantors
Non-
Guarantor
Subsidiaries Eliminations Consolidated
Cash flows from operating activities:
Net income ................................. $ 729,111 $ 394,096 $ 102,898 $(459,883) $ 766,222
Adjustments to reconcile net income to net
cash provided by operating activities:
Depreciation and amortization ............. 54,627 185,743 16,317 — 256,687
Provision for doubtful accounts ............ 5,986 68,089 246,899 — 320,974
Other, net ................................ (381,358) 96,546 7,267 459,883 182,338
Changes in operating assets and
liabilities ............................... 228,809 (559,602) (198,010) — (528,803)
Net cash provided by operating activities ..... 637,175 184,872 175,371 — 997,418
Net cash (used in) provided by investing
activities. ................................. (15,549) (160,259) 14,372 (34,468) (195,904)
Net cash used in financing activities . . . ...... (375,233) (13,871) (166,568) 34,468 (521,204)
Net change in cash and cash equivalents ..... 246,393 10,742 23,175 — 280,310
Cash and cash equivalents, beginning
of year . . ................................. 218,565 6,715 28,666 — 253,946
Cash and cash equivalents, end of year. ...... $ 464,958 $ 17,457 $ 51,841 $ — $ 534,256
F-42
QUEST DIAGNOSTICS INCORPORATED AND SUBSIDIARIES
NOTES TO CONSOLIDATED FINANCIAL STATEMENTS - CONTINUED
(dollars in thousands unless otherwise indicated)