Quest Diagnostics 2011 Annual Report Download - page 77
Download and view the complete annual report
Please find page 77 of the 2011 Quest Diagnostics annual report below. You can navigate through the pages in the report by either clicking on the pages listed below, or by using the keyword search tool below to find specific information within the annual report.-
 1
1 -
2
-
3
-
4
-
5
-
6
-
7
-
8
-
9
-
10
-
11
-
12
-
13
-
14
-
15
-
16
-
17
-
18
-
19
-
20
-
21
-
22
-
23
-
24
-
25
-
26
-
27
-
28
-
29
-
30
-
31
-
32
-
33
-
34
-
35
-
36
-
37
-
38
-
39
-
40
-
41
-
42
-
43
-
44
-
45
-
46
-
47
-
48
-
49
-
50
-
51
-
52
-
53
-
54
-
55
-
56
-
57
-
58
-
59
-
60
-
61
-
62
-
63
-
64
-
65
-
66
-
 67
67 -
 68
68 -
 69
69 -
 70
70 -
 71
71 -
 72
72 -
 73
73 -
 74
74 -
 75
75 -
 76
76 -
 77
77 -
 78
78 -
 79
79 -
 80
80 -
 81
81 -
 82
82 -
 83
83 -
 84
84 -
 85
85 -
 86
86 -
 87
87 -
88
-
89
-
90
-
91
-
92
-
93
-
94
-
95
-
96
-
97
-
98
-
99
-
100
-
101
-
102
-
103
-
104
-
105
-
106
-
107
-
108
-
109
-
110
-
111
-
112
-
113
-
114
-
115
-
116
-
117
-
118
-
119
-
120
-
121
-
122
-
123
 |
 |

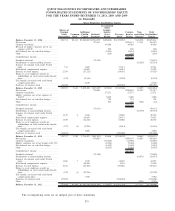
QUEST DIAGNOSTICS INCORPORATED AND SUBSIDIARIES
CONSOLIDATED STATEMENTS OF STOCKHOLDERS’ EQUITY
FOR THE YEARS ENDED DECEMBER 31, 2011, 2010 AND 2009
(in thousands)
Shares of
Common
Stock
Outstanding
Common
Stock
Additional
Paid-In
Capital
Retained
Earnings
Accumulated
Other
Compre-
hensive
(Loss)
Income
Treasury
Stock
Compre-
hensive
Income
Non-
controlling
Interests
Total
Stockholders’
Equity
Quest Diagnostics Stockholders’ Equity
Balance, December 31, 2008 . . . . . . . . . . . . . . . . 190,374 $2,141 $2,262,065 $2,561,679 $(68,068) $(1,152,921) $ 20,238 $3,625,134
Net income . . . . . . . . . . . . ..................... 729,111 $729,111 37,111 766,222
Currency translation . . . . ..................... 49,586 49,586 49,586
Reversal of market valuation, net of tax
expense of $190 . . . . . ..................... 290 290 290
Net deferred loss on cash flow hedges. . . . . . . . (2,553) (2,553) (2,553)
Other....................................... (216) (216) (216)
Comprehensive income . ..................... $776,218
Dividends declared . . . . . ..................... (74,151) (74,151)
Distributions to noncontrolling interests . . . . . . . (35,524) (35,524)
Issuance of common stock under benefit
plans . . . . . . . . . . . . . . . . ..................... 711 1,868 17,913 19,781
Stock-based compensation expense . . . . . . . . . . . 61,005 14,054 75,059
Exercise of stock options . . . . . . . . . . . . . . . . . . . . 2,376 (27,272) 114,392 87,120
Shares to cover employee payroll tax
withholdings on stock issued under benefit
plans . . . . . . . . . . . . . . . . ..................... (135) (2,144) (3,995) (6,139)
Tax benefits associated with stock-based
compensation plans . . ..................... 6,846 6,846
Purchases of treasury stock . . . . . . . . . . . . . . . . . . (10,033) (499,991) (499,991)
Balance, December 31, 2009 . . . . . . . . . . . . . . . . 183,293 2,141 2,302,368 3,216,639 (20,961) (1,510,548) 21,825 4,011,464
Net income . . . . . . . . . . . . ..................... 720,894 $720,894 36,123 757,017
Currency translation . . . . ..................... 27,271 27,271 27,271
Market valuation, net of tax expense of
$1,975. . . . . . . . . . . . . . . ..................... 3,090 3,090 3,090
Net deferred loss on cash flow hedges. . . . . . . . 724 724 724
Other....................................... 502 502 (564) (62)
Comprehensive income . ..................... $752,481
Dividends declared . . . . . ..................... (70,113) (70,113)
Distributions to noncontrolling interests . . . . . . . (36,739) (36,739)
Issuance of common stock under benefit
plans . . . . . . . . . . . . . . . . ..................... 1,125 2 1,050 19,480 20,532
Stock-based compensation expense . . . . . . . . . . . 24,454 29,473 53,927
Exercise of stock options . . . . . . . . . . . . . . . . . . . . 1,269 (14,545) 63,080 48,535
Shares to cover employee payroll tax
withholdings on stock issued under benefit
plans . . . . . . . . . . . . . . . . ..................... (277) (1) (5,786) (9,614) (15,401)
Tax benefits associated with stock-based
compensation plans . . ..................... 3,880 3,880
Purchases of treasury stock . . . . . . . . . . . . . . . . . . (14,693) (750,000) (750,000)
Balance, December 31, 2010 . . . . . . . . . . . . . . . . 170,717 2,142 2,311,421 3,867,420 10,626 (2,158,129) 20,645 4,054,125
Net income . . . . . . . . . . . . ..................... 470,567 $470,567 35,083 505,650
Currency translation . . . . ..................... (12,920) (12,920) (12,920)
Market valuation, net of tax benefit of $1,724 (2,696) (2,696) (2,696)
Net deferred loss on cash flow hedges. . . . . . . . (1,042) (1,042) (1,042)
Other....................................... (2,035) (2,035) (2,035)
Comprehensive income . ..................... $451,874
Dividends declared . . . . . ..................... (74,388) (74,388)
Distributions to noncontrolling interests . . . . . . . (35,671) (35,671)
Issuance of common stock under benefit
plans . . . . . . . . . . . . . . . . ..................... 1,206 7 1,919 18,001 19,927
Stock-based compensation expense . . . . . . . . . . . 68,388 3,518 71,906
Exercise of stock options . . . . . . . . . . . . . . . . . . . . 3,141 (22,462) 159,280 136,818
Shares to cover employee payroll tax
withholdings on stock issued under benefit
plans . . . . . . . . . . . . . . . . ..................... (347) (3) (19,706) (19,709)
Tax benefits associated with stock-based
compensation plans . . ..................... 7,958 7,958
Purchases of treasury stock . . . . . . . . . . . . . . . . . . (17,297) (934,994) (934,994)
Other....................................... 2,070 2,070
Balance, December 31, 2011 . . . . . . . . . . . . . . . . 157,420 $2,146 $2,347,518 $4,263,599 $ (8,067) $(2,912,324) $ 22,127 $3,714,999
The accompanying notes are an integral part of these statements.
F-5