Oracle 2013 Annual Report Download - page 72
Download and view the complete annual report
Please find page 72 of the 2013 Oracle annual report below. You can navigate through the pages in the report by either clicking on the pages listed below, or by using the keyword search tool below to find specific information within the annual report.-
 1
1 -
2
-
3
-
4
-
5
-
6
-
7
-
8
-
9
-
10
-
11
-
12
-
13
-
14
-
15
-
16
-
17
-
18
-
19
-
20
-
21
-
22
-
23
-
24
-
25
-
26
-
27
-
28
-
29
-
30
-
31
-
32
-
33
-
34
-
35
-
36
-
37
-
38
-
39
-
40
-
41
-
42
-
43
-
44
-
45
-
46
-
47
-
48
-
49
-
50
-
51
-
52
-
53
-
54
-
55
-
56
-
57
-
58
-
59
-
60
-
61
-
 62
62 -
 63
63 -
 64
64 -
 65
65 -
 66
66 -
 67
67 -
 68
68 -
 69
69 -
 70
70 -
 71
71 -
 72
72 -
 73
73 -
 74
74 -
 75
75 -
 76
76 -
 77
77 -
 78
78 -
 79
79 -
 80
80 -
 81
81 -
 82
82 -
83
-
84
-
85
-
86
-
87
-
88
-
89
-
90
-
91
-
92
-
93
-
94
-
95
-
96
-
97
-
98
-
99
-
100
-
101
-
102
-
103
-
104
-
105
-
106
-
107
-
108
-
109
-
110
-
111
-
112
-
113
-
114
-
115
-
116
-
117
-
118
-
119
-
120
-
121
-
122
-
123
-
124
-
125
-
126
-
127
-
128
-
129
-
130
-
131
-
132
-
133
-
134
-
135
-
136
-
137
-
138
-
139
-
140
-
141
-
142
-
143
-
144
-
145
-
146
-
147
-
148
-
149
-
150
-
151
 |
 |

Table of Contents
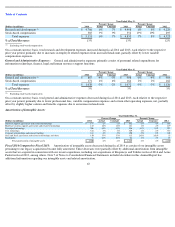
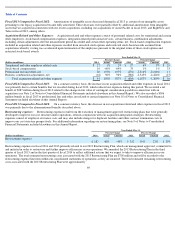
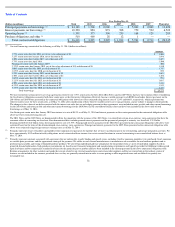
Cash flows from operating activities: Our largest source of operating cash flows is cash collections from our customers following the
purchase and renewal of their software license updates and product support agreements. Payments from customers for these support agreements
are generally received near the beginning of the contracts’ terms, which are generally one year in length. We also generate significant cash from
new software licenses sales and sales of hardware systems support arrangements, and to a lesser extent, sales of services, hardware systems
products, and cloud SaaS and PaaS offerings. Our primary uses of cash from operating activities are for employee related expenditures, material
and manufacturing costs related to the production of our hardware systems products, taxes and leased facilities.
Fiscal 2014 Compared to Fiscal 2013:
Net cash provided by operating activities increased in fiscal 2014 in comparison to fiscal 2013
primarily due to the following: the fiscal 2013 non-recurring impacts of a reduction of contingent consideration payable in connection with an
acquisition of $387 million (see Note 2 of Notes to Consolidated Financial Statements included elsewhere in this Annual Report for additional
information) and the impact of a $306 million non-
current receivable related to certain litigation (see Note 14 of Notes to Consolidated Financial
Statements included elsewhere in this Annual Report for additional information), both of which increased our net income in fiscal 2013 without
the corresponding cash flow benefits. These items did not recur during fiscal 2014.
Fiscal 2013 Compared to Fiscal 2012:
Net cash provided by operating activities increased in fiscal 2013 in comparison to fiscal 2012
primarily due to cash favorable impacts of increased net income adjusted for amortization of intangible assets, stock-based compensation and
depreciation during fiscal 2013 in comparison to fiscal 2012.
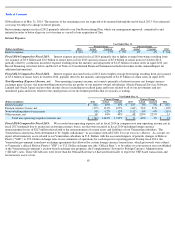
Cash flows from investing activities: The changes in cash flows from investing activities primarily relate to acquisitions and the timing of
purchases, maturities and sales of our investments in marketable debt securities. We also use cash to invest in capital and other assets, including
certain intangible assets, to support our growth.
Fiscal 2014 Compared to Fiscal 2013:
Net cash used for investing activities increased in fiscal 2014 due to an increase in net cash used to
purchase marketable securities (net of proceeds received from sales and maturities) and an increase in cash used for acquisitions, net of cash
acquired, in each case during fiscal 2014 in comparison to fiscal 2013.
Fiscal 2013 Compared to Fiscal 2012:
Net cash used for investing activities decreased in fiscal 2013 primarily due to a decrease in net cash
used to purchase marketable securities (net of proceeds received from sales and maturities) and a decrease in cash used for acquisitions, net of
cash acquired, in each case during fiscal 2013 in comparison to fiscal 2012.
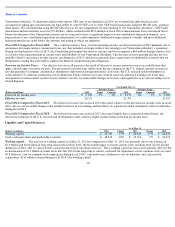
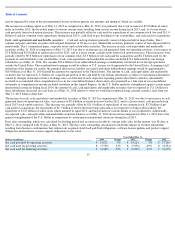
Cash flows from financing activities: The changes in cash flows from financing activities primarily relate to borrowings and repayments
related to our debt instruments as well as stock repurchases, dividend payments and proceeds from stock option exercises.
Fiscal 2014 Compared to Fiscal 2013:
Net cash used for financing activities in fiscal 2014 decreased in comparison to fiscal 2013 primarily
due to the repayment of $3.0 billion of borrowings pursuant to senior notes maturities and certain expired revolving credit facilities in fiscal
2013 (no repayments during fiscal 2014), a net increase in borrowings during fiscal 2014 (we issued €2.0 billion and $3.0 billion of senior notes
during fiscal 2014 in comparison to $5.0 billion of senior notes issued during fiscal 2013), lower stock repurchase activity during fiscal 2014 and
higher proceeds from stock option exercises
during fiscal 2014. These fiscal 2014 cash favorable variances were partially offset by an increase in
payments of cash dividends to stockholders in fiscal 2014 in comparison to fiscal 2013.
Fiscal 2013 Compared to Fiscal 2012:
Net cash used for financing activities in fiscal 2013 increased in comparison to fiscal 2012 primarily
due to an increase in our common stock repurchases (we used $11.0 billion of cash for common stock repurchases during fiscal 2013 in
comparison to $5.9 billion in fiscal 2012) and an increase in repayments of borrowings (we repaid $3.0 billion of borrowings pursuant to senior
notes maturities and certain expired revolving credit facilities in fiscal 2013 in comparison to the repayments of $1.4 billion of short-term
borrowings from expired revolving credit facilities, and legacy convertible notes assumed from RightNow in fiscal 2012), partially offset by our
issuance of $5.0 billion of senior notes in October 2012, an increase in proceeds from stock option exercises and certain other financing activity
cash flow increases, net.
68