Oracle 2013 Annual Report Download - page 63
Download and view the complete annual report
Please find page 63 of the 2013 Oracle annual report below. You can navigate through the pages in the report by either clicking on the pages listed below, or by using the keyword search tool below to find specific information within the annual report.-
 1
1 -
2
-
3
-
4
-
5
-
6
-
7
-
8
-
9
-
10
-
11
-
12
-
13
-
14
-
15
-
16
-
17
-
18
-
19
-
20
-
21
-
22
-
23
-
24
-
25
-
26
-
27
-
28
-
29
-
30
-
31
-
32
-
33
-
34
-
35
-
36
-
37
-
38
-
39
-
40
-
41
-
42
-
43
-
44
-
45
-
46
-
47
-
48
-
49
-
50
-
51
-
52
-
 53
53 -
 54
54 -
 55
55 -
 56
56 -
 57
57 -
 58
58 -
 59
59 -
 60
60 -
 61
61 -
 62
62 -
 63
63 -
 64
64 -
 65
65 -
 66
66 -
 67
67 -
 68
68 -
 69
69 -
 70
70 -
 71
71 -
 72
72 -
 73
73 -
74
-
75
-
76
-
77
-
78
-
79
-
80
-
81
-
82
-
83
-
84
-
85
-
86
-
87
-
88
-
89
-
90
-
91
-
92
-
93
-
94
-
95
-
96
-
97
-
98
-
99
-
100
-
101
-
102
-
103
-
104
-
105
-
106
-
107
-
108
-
109
-
110
-
111
-
112
-
113
-
114
-
115
-
116
-
117
-
118
-
119
-
120
-
121
-
122
-
123
-
124
-
125
-
126
-
127
-
128
-
129
-
130
-
131
-
132
-
133
-
134
-
135
-
136
-
137
-
138
-
139
-
140
-
141
-
142
-
143
-
144
-
145
-
146
-
147
-
148
-
149
-
150
-
151
 |
 |

Table of Contents
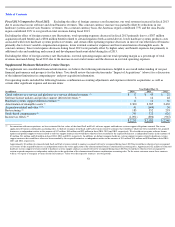
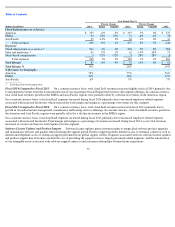
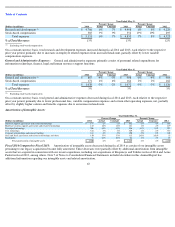
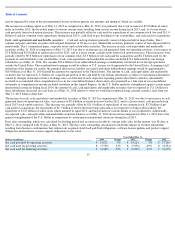
Excluding the effect of favorable foreign currency rate fluctuations, total software license updates and product support expenses decreased in
fiscal 2013 primarily due to lower amortization of intangible assets, a reduction in certain non-income based taxes, lower bad debt expenses, and
lower variable compensation expenses.
Excluding the effect of currency rate fluctuations, total software license updates and product support margin and margin as a percentage of
revenues increased in fiscal 2013 as our total revenues for this segment increased while our total expenses decreased.
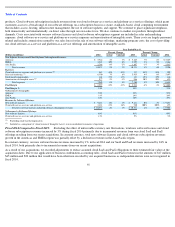
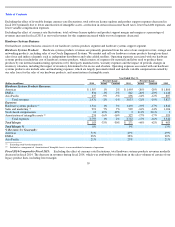
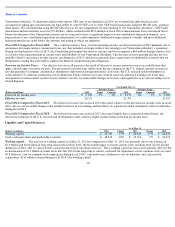
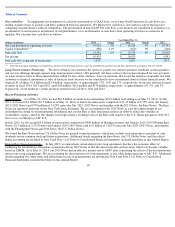
Hardware Systems Business
Our hardware systems business consists of our hardware systems products segment and hardware systems support segment.
Hardware Systems Products:
Hardware systems products revenues are primarily generated from the sales of our computer server, storage and
networking products, including sales of our Oracle Engineered Systems. We market and sell our hardware systems products through our direct
sales force and indirect channels such as independent distributors and value added resellers. Operating expenses associated with our hardware
systems products include the cost of hardware systems products, which consists of expenses for materials and labor used to produce these
products by our internal manufacturing operations or by third party manufacturers, warranty expenses and the impact of periodic changes in
inventory valuation, including the impact of inventory determined to be excess and obsolete. Operating expenses associated with our hardware
systems products also include sales and marketing expenses, which are largely personnel related and include variable compensation earned by
our sales force for the sales of our hardware products, and amortization of intangible assets.
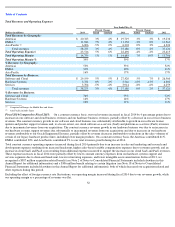
Fiscal 2014 Compared to Fiscal 2013: Excluding the effect of currency rate fluctuations, total hardware systems products revenues modestly
decreased in fiscal 2014. The decrease in revenues during fiscal 2014, which was attributable to reductions in the sales volumes of certain of our
legacy product lines, including lower margin
59
Year Ended May 31,
Percent Change
Percent Change
(Dollars in millions)
2014
Actual
Constant
2013
Actual
Constant
2012
Hardware Systems Products Revenues:
Americas
$
1,507
1%
2%
$
1,495
-
20%
-
20%
$
1,880
EMEA
834
-
1%
-
3%
842
-
26%
-
23%
1,140
Asia Pacific
635
-
9%
-
5%
696
-
14%
-
12%
807
Total revenues
2,976
-
2%
-
1%
3,033
-
21%
-
19%
3,827
Expenses:
Hardware systems products
1,516
1%
3%
1,498
-
19%
-
17%
1,842
Sales and marketing
991
7%
7%
929
-
16%
-
14%
1,106
Stock
-
based compensation
12
49%
49%
8
211%
211%
3
Amortization of intangible assets
274
-
16%
-
16%
327
-
17%
-
17%
393
Total expenses
2,793
1%
2%
2,762
-
17%
-
16%
3,344
Total Margin
$
183
-
33%
-
30%
$
271
-
44%
-
42%
$
483
Total Margin %
6%
9%
13%
% Revenues by Geography:
Americas
51%
49%
49%
EMEA
28%
28%
30%
Asia Pacific
21%
23%
21%
Excluding stock
-
based compensation
Included as a component of
‘
Amortization of Intangible Assets
’
in our consolidated statements of operations
(1)
(1)
(2)
(1)
(2)