Oracle 2013 Annual Report Download - page 67
Download and view the complete annual report
Please find page 67 of the 2013 Oracle annual report below. You can navigate through the pages in the report by either clicking on the pages listed below, or by using the keyword search tool below to find specific information within the annual report.-
 1
1 -
2
-
3
-
4
-
5
-
6
-
7
-
8
-
9
-
10
-
11
-
12
-
13
-
14
-
15
-
16
-
17
-
18
-
19
-
20
-
21
-
22
-
23
-
24
-
25
-
26
-
27
-
28
-
29
-
30
-
31
-
32
-
33
-
34
-
35
-
36
-
37
-
38
-
39
-
40
-
41
-
42
-
43
-
44
-
45
-
46
-
47
-
48
-
49
-
50
-
51
-
52
-
53
-
54
-
55
-
56
-
 57
57 -
 58
58 -
 59
59 -
 60
60 -
 61
61 -
 62
62 -
 63
63 -
 64
64 -
 65
65 -
 66
66 -
 67
67 -
 68
68 -
 69
69 -
 70
70 -
 71
71 -
 72
72 -
 73
73 -
 74
74 -
 75
75 -
 76
76 -
 77
77 -
78
-
79
-
80
-
81
-
82
-
83
-
84
-
85
-
86
-
87
-
88
-
89
-
90
-
91
-
92
-
93
-
94
-
95
-
96
-
97
-
98
-
99
-
100
-
101
-
102
-
103
-
104
-
105
-
106
-
107
-
108
-
109
-
110
-
111
-
112
-
113
-
114
-
115
-
116
-
117
-
118
-
119
-
120
-
121
-
122
-
123
-
124
-
125
-
126
-
127
-
128
-
129
-
130
-
131
-
132
-
133
-
134
-
135
-
136
-
137
-
138
-
139
-
140
-
141
-
142
-
143
-
144
-
145
-
146
-
147
-
148
-
149
-
150
-
151
 |
 |
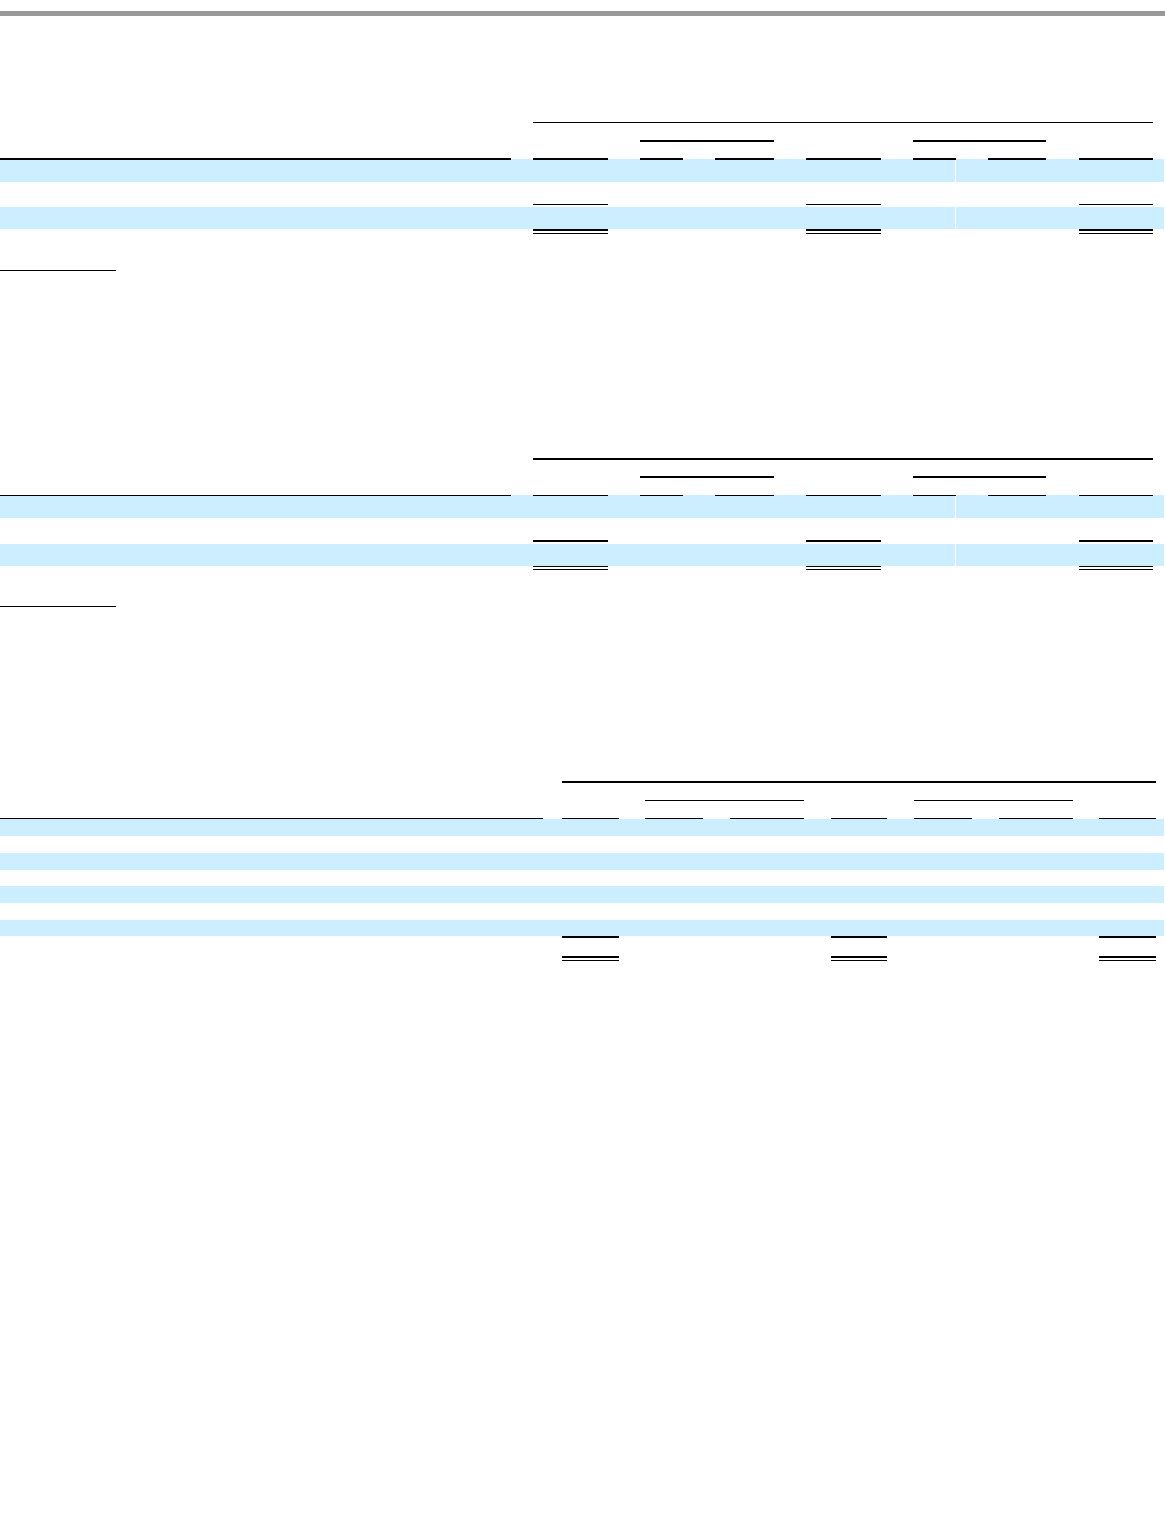
Table of Contents
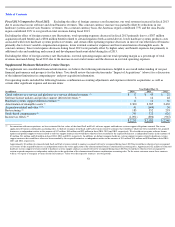
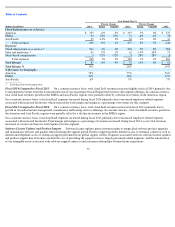
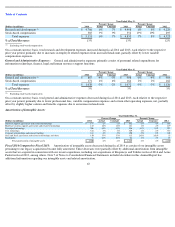
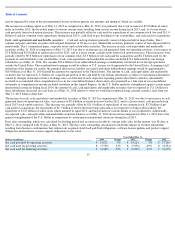
On a constant currency basis, total research and development expenses increased during fiscal 2014 and 2013, each relative to the respective
prior year period, primarily due to increases in employee related expenses from increased headcount, partially offset by lower variable
compensation expenses.
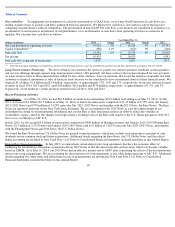
General and Administrative Expenses: General and administrative expenses primarily consist of personnel related expenditures for
information technology, finance, legal and human resources support functions.
On a constant currency basis, total general and administrative expenses decreased during fiscal 2014 and 2013, each relative to the respective
prior year period, primarily due to lower professional fees, variable compensation expenses and certain other operating expenses, net, partially
offset by slightly higher salaries and benefits expenses due to an increase in headcount.
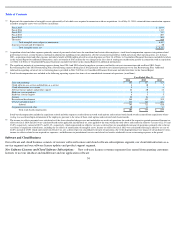
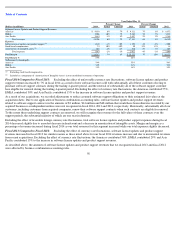
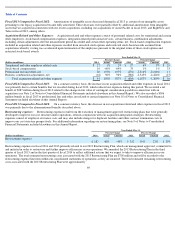
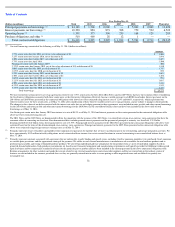
Amortization of Intangible Assets:
Fiscal 2014 Compared to Fiscal 2013: Amortization of intangible assets decreased during fiscal 2014 as certain of our intangible assets
pertaining to our legacy acquisitions became fully amortized. These decreases were partially offset by additional amortization from intangible
assets that we acquired in connection with our recent acquisitions, including our acquisitions of Responsys and Tekelec in fiscal 2014 and Acme
Packet in fiscal 2013, among others. Note 7 of Notes to Consolidated Financial Statements included elsewhere in this Annual Report has
additional information regarding our intangible assets and related amortization.
63
Year Ended May 31,
Percent Change
Percent Change
(Dollars in millions)
2014
Actual
Constant
2013
Actual
Constant
2012
Research and development
$
4,766
6%
7%
$
4,498
6%
8%
$
4,228
Stock
-
based compensation
385
9%
9%
352
19%
19%
295
Total expenses
$
5,151
6%
7%
$
4,850
7%
8%
$
4,523
% of Total Revenues
13%
13%
12%
Excluding stock
-
based compensation
Year Ended May 31,
Percent Change
Percent Change
(Dollars in millions)
2014
Actual
Constant
2013
Actual
Constant
2012
General and administrative
$
867
-
4%
-
3%
$
908
-
6%
-
4%
$
964
Stock
-
based compensation
171
4%
4%
164
2%
2%
162
Total expenses
$
1,038
-
3%
-
2%
$
1,072
-
5%
-
3%
$
1,126
% of Total Revenues
3%
3%
3%
Excluding stock
-
based compensation
Year Ended May 31,
Percent Change
Percent Change
(Dollars in millions)
2014
Actual
Constant
2013
Actual
Constant
2012
Software support agreements and related relationships
$
571
-
2%
-
2%
$
582
-
1%
-
1%
$
585
Hardware systems support agreements and related relationships
143
18%
18%
121
2%
2%
119
Developed technology
706
-
15%
-
15%
826
-
11%
-
11%
923
Core technology
318
-
3%
-
3%
329
-
2%
-
2%
337
Customer relationships and contract backlog
334
-
5%
-
5%
350
-
5%
-
5%
370
SaaS and PaaS agreements and related relationships and other
150
33%
33%
113
242%
242%
33
Trademarks
78
22%
22%
64
2%
2%
63
Total amortization of intangible assets
$
2,300
-
4%
-
4%
$
2,385
-
2%
-
2%
$
2,430
(1)
(1)
(1)
(1)