Oracle 2013 Annual Report Download - page 56
Download and view the complete annual report
Please find page 56 of the 2013 Oracle annual report below. You can navigate through the pages in the report by either clicking on the pages listed below, or by using the keyword search tool below to find specific information within the annual report.-
 1
1 -
2
-
3
-
4
-
5
-
6
-
7
-
8
-
9
-
10
-
11
-
12
-
13
-
14
-
15
-
16
-
17
-
18
-
19
-
20
-
21
-
22
-
23
-
24
-
25
-
26
-
27
-
28
-
29
-
30
-
31
-
32
-
33
-
34
-
35
-
36
-
37
-
38
-
39
-
40
-
41
-
42
-
43
-
44
-
45
-
 46
46 -
 47
47 -
 48
48 -
 49
49 -
 50
50 -
 51
51 -
 52
52 -
 53
53 -
 54
54 -
 55
55 -
 56
56 -
 57
57 -
 58
58 -
 59
59 -
 60
60 -
 61
61 -
 62
62 -
 63
63 -
 64
64 -
 65
65 -
 66
66 -
67
-
68
-
69
-
70
-
71
-
72
-
73
-
74
-
75
-
76
-
77
-
78
-
79
-
80
-
81
-
82
-
83
-
84
-
85
-
86
-
87
-
88
-
89
-
90
-
91
-
92
-
93
-
94
-
95
-
96
-
97
-
98
-
99
-
100
-
101
-
102
-
103
-
104
-
105
-
106
-
107
-
108
-
109
-
110
-
111
-
112
-
113
-
114
-
115
-
116
-
117
-
118
-
119
-
120
-
121
-
122
-
123
-
124
-
125
-
126
-
127
-
128
-
129
-
130
-
131
-
132
-
133
-
134
-
135
-
136
-
137
-
138
-
139
-
140
-
141
-
142
-
143
-
144
-
145
-
146
-
147
-
148
-
149
-
150
-
151
 |
 |

Table of Contents
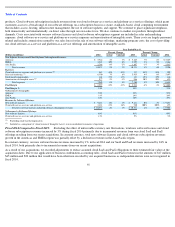
Total Revenues and Operating Expenses
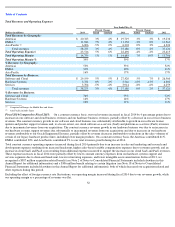
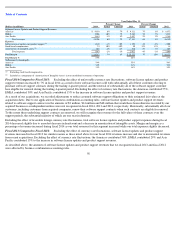
Fiscal 2014 Compared to Fiscal 2013: On a constant currency basis, our total revenues increased in fiscal 2014 by 4 percentage points due to
increases in our software and cloud business revenues and our hardware business revenues, partially offset by a decrease in our services business
revenues. The constant currency growth in our software and cloud business was substantially attributable to growth in our software license
updates and product support revenues and, to a lesser extent, our cloud software-as-a-service (SaaS) and platform-as-a-service (PaaS) revenues
due to incremental revenues from our acquisitions. The constant currency revenues growth in our hardware business was due to an increase in
our hardware systems support revenues due substantially to incremental revenues from our acquisitions and due to increases in our hardware
revenues attributable to our Oracle Engineered Systems, partially offset by revenue decreases attributable to reductions in the sales volumes of
certain of our legacy hardware product lines, including lower margin products. On a constant currency basis, the Americas contributed 61%,
EMEA contributed 30% and Asia Pacific contributed 9% to our total revenues growth during fiscal 2014.
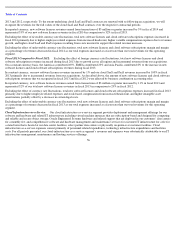
Total constant currency operating expenses increased during fiscal 2014 primarily due to an increase in sales and marketing and research and
development expenses resulting from increased headcount, higher sales-based variable compensation expenses due to revenues growth, and an
increase in cloud SaaS and PaaS costs resulting from additional expenses incurred to support the increases in our cloud SaaS and PaaS revenues.
These expense increases in fiscal 2014 were partially offset by lower constant currency expenses from our hardware systems support and
services segments due to decreased headcount, lower restructuring expenses, and lower intangible assets amortization. In fiscal 2013, we
recognized a $387 million acquisition related benefit (see Note 2 of Notes to Consolidated Financial Statements included elsewhere in this
Annual Report for additional information) and a $306 million benefit relating to certain litigation (see Note 18 of Notes to Consolidated
Financial Statements included elsewhere in this Annual Report for additional information), both of which decreased our acquisition related and
other expenses during this period.
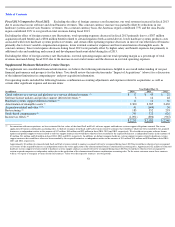
Excluding the effect of foreign currency rate fluctuations, our operating margin increased during fiscal 2014 due to our revenues growth, while
our operating margin as a percentage of revenues was flat.
52
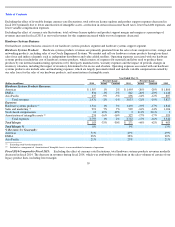
Year Ended May 31,
Percent Change
Percent Change
(Dollars in millions)
2014
Actual
Constant
2013
Actual
Constant
2012
Total Revenues by Geography:
Americas
$
20,323
3%
4%
$
19,719
3%
3%
$
19,236
EMEA
11,946
7%
4%
11,158
-
3%
0%
11,561
Asia Pacific
6,006
-
5%
2%
6,303
0%
3%
6,324
Total revenues
38,275
3%
4%
37,180
0%
2%
37,121
Total Operating Expenses
23,516
5%
6%
22,496
-
4%
-
2%
23,415
Total Operating Margin
$
14,759
1%
1%
$
14,684
7%
10%
$
13,706
Total Operating Margin %
39%
39%
37%
% Revenues by Geography:
Americas
53%
53%
52%
EMEA
31%
30%
31%
Asia Pacific
16%
17%
17%
Total Revenues by Business:
Software and Cloud
$
29,199
5%
5%
$
27,920
5%
7%
$
26,560
Hardware Systems
5,372
0%
2%
5,346
-
15%
-
13%
6,302
Services
3,704
-
5%
-
4%
3,914
-
8%
-
6%
4,259
Total revenues
$
38,275
3%
4%
$
37,180
0%
2%
$
37,121
% Revenues by Business:
Software and Cloud
76%
75%
72%
Hardware Systems
14%
14%
17%
Services
10%
11%
11%
Comprised of Europe, the Middle East and Africa
Asia Pacific includes Japan
(1)
(2)
(1)
(2)