Oracle 2013 Annual Report Download - page 71
Download and view the complete annual report
Please find page 71 of the 2013 Oracle annual report below. You can navigate through the pages in the report by either clicking on the pages listed below, or by using the keyword search tool below to find specific information within the annual report.-
 1
1 -
2
-
3
-
4
-
5
-
6
-
7
-
8
-
9
-
10
-
11
-
12
-
13
-
14
-
15
-
16
-
17
-
18
-
19
-
20
-
21
-
22
-
23
-
24
-
25
-
26
-
27
-
28
-
29
-
30
-
31
-
32
-
33
-
34
-
35
-
36
-
37
-
38
-
39
-
40
-
41
-
42
-
43
-
44
-
45
-
46
-
47
-
48
-
49
-
50
-
51
-
52
-
53
-
54
-
55
-
56
-
57
-
58
-
59
-
60
-
 61
61 -
 62
62 -
 63
63 -
 64
64 -
 65
65 -
 66
66 -
 67
67 -
 68
68 -
 69
69 -
 70
70 -
 71
71 -
 72
72 -
 73
73 -
 74
74 -
 75
75 -
 76
76 -
 77
77 -
 78
78 -
 79
79 -
 80
80 -
 81
81 -
82
-
83
-
84
-
85
-
86
-
87
-
88
-
89
-
90
-
91
-
92
-
93
-
94
-
95
-
96
-
97
-
98
-
99
-
100
-
101
-
102
-
103
-
104
-
105
-
106
-
107
-
108
-
109
-
110
-
111
-
112
-
113
-
114
-
115
-
116
-
117
-
118
-
119
-
120
-
121
-
122
-
123
-
124
-
125
-
126
-
127
-
128
-
129
-
130
-
131
-
132
-
133
-
134
-
135
-
136
-
137
-
138
-
139
-
140
-
141
-
142
-
143
-
144
-
145
-
146
-
147
-
148
-
149
-
150
-
151
 |
 |

Table of Contents
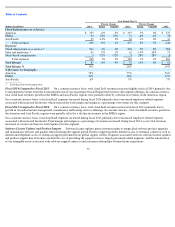
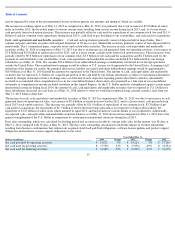
may be impacted by some of the aforementioned factors in future periods, the amounts and timing of which are variable.
The increase in working capital as of May 31, 2013 in comparison to May 31, 2012 was primarily due to our issuance of $5.0 billion of senior
notes in October 2012, the favorable impact to our net current assets resulting from our net income during fiscal 2013, and, to a lesser extent,
cash proceeds from stock option exercises. This increase was partially offset by cash used for repurchases of our common stock (we used $11.0
billion of cash for common stock repurchases during fiscal 2013), cash used to pay dividends to our stockholders, and cash used for acquisitions.
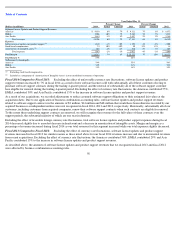
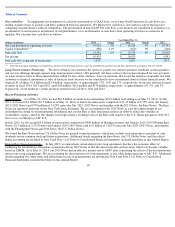
Cash, cash equivalents and marketable securities: Cash and cash equivalents primarily consist of deposits held at major banks, Tier-1
commercial paper and other securities with original maturities of 90 days or less. Marketable securities primarily consist of time deposits held at
major banks, Tier-1 commercial paper, corporate notes, and certain other securities. The increase in cash, cash equivalents and marketable
securities at May 31, 2014 in comparison to May 31, 2013 was due to an increase in cash generated from our operating activities, our issuance of
€
2.0 billion and $3.0 billion of senior notes in July 2013, and to a lesser extent, cash proceeds from stock option exercises. These increases were
partially offset by $9.8 billion of repurchases of our common stock, $3.5 billion of net cash paid for acquisitions and $2.2 billion used for the
payment of cash dividends to our stockholders. Cash, cash equivalents and marketable securities included $35.2 billion held by our foreign
subsidiaries as of May 31, 2014. We consider $32.4 billion of our undistributed earnings as indefinitely reinvested in our foreign operations
outside the United States. These undistributed earnings would be subject to U.S. income tax if repatriated to the United States. Assuming a full
utilization of the foreign tax credits, the potential deferred tax liability associated with these undistributed earnings would be approximately
$10.0 billion as of May 31, 2014 should the amounts be repatriated to the United States. The amount of cash, cash equivalents and marketable
securities that we report in U.S. Dollars for a significant portion of the cash held by our foreign subsidiaries is subject to translation adjustments
caused by changes in foreign currency exchange rates as of the end of each respective reporting period (the offset to which is substantially
recorded to accumulated other comprehensive loss in our consolidated balance sheets and is also presented as a line item in our consolidated
statements of comprehensive income included elsewhere in this Annual Report). As the U.S. Dollar modestly strengthened against certain major
international currencies during fiscal 2014, the amount of cash, cash equivalents and marketable securities that we reported in U.S. Dollars for
these subsidiaries decreased on a net basis as of May 31, 2014 relative to what we would have reported using constant currency rates from our
May 31, 2013 balance sheet date.
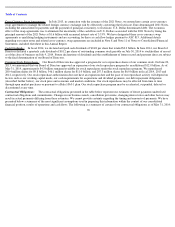
The increase in cash, cash equivalents and marketable securities at May 31, 2013 in comparison to May 31, 2012 was due to an increase in cash
generated from our operating activities, our issuance of $5.0 billion of senior notes in October 2012, and to a lesser extent, cash proceeds from
fiscal 2013 stock option exercises. This increase was partially offset by $11.0 billion of repurchases of our common stock, $3.3 billion of net
cash paid for acquisitions, the repayments of $1.7 billion of short-term borrowings pursuant to our expired revolving credit facilities, the
repayment of $1.25 billion of senior notes which matured in April 2013, and the payment of cash dividends to our stockholders. Additionally,
our reported cash, cash equivalents and marketable securities balances as of May 31, 2013 decreased in comparison to May 31, 2012 due to the
general strengthening of the U.S. Dollar in comparison to certain major international currencies during fiscal 2013.
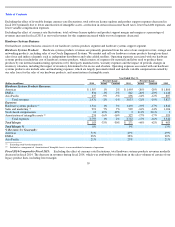
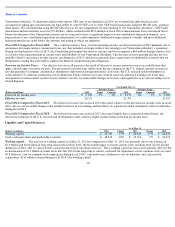
Days sales outstanding, which was calculated by dividing period end accounts receivable by average daily sales for the quarter, was 48 days at
May 31, 2014 compared with 50 days at May 31, 2013. The days sales outstanding calculation excluded the impact of revenue adjustments
resulting from business combinations that reduced our acquired cloud SaaS and PaaS obligations, software license updates and product support
obligations and hardware systems support obligations to fair value.
67
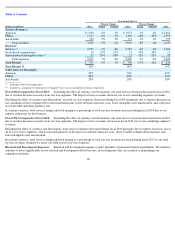
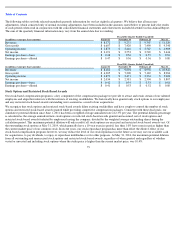
Year Ended May 31,
(Dollars in millions)
2014
Change
2013
Change
2012
Net cash provided by operating activities
$
14,921
5%
$
14,224
3%
$
13,743
Net cash used for investing activities
$
(7,539
)
27%
$
(5,956
)
-
29%
$
(8,381
)
Net cash used for financing activities
$
(4,068
)
-
52%
$
(8,500
)
39%
$
(6,099
)