Oracle 2013 Annual Report Download - page 125
Download and view the complete annual report
Please find page 125 of the 2013 Oracle annual report below. You can navigate through the pages in the report by either clicking on the pages listed below, or by using the keyword search tool below to find specific information within the annual report.-
 1
1 -
2
-
3
-
4
-
5
-
6
-
7
-
8
-
9
-
10
-
11
-
12
-
13
-
14
-
15
-
16
-
17
-
18
-
19
-
20
-
21
-
22
-
23
-
24
-
25
-
26
-
27
-
28
-
29
-
30
-
31
-
32
-
33
-
34
-
35
-
36
-
37
-
38
-
39
-
40
-
41
-
42
-
43
-
44
-
45
-
46
-
47
-
48
-
49
-
50
-
51
-
52
-
53
-
54
-
55
-
56
-
57
-
58
-
59
-
60
-
61
-
62
-
63
-
64
-
65
-
66
-
67
-
68
-
69
-
70
-
71
-
72
-
73
-
74
-
75
-
76
-
77
-
78
-
79
-
80
-
81
-
82
-
83
-
84
-
85
-
86
-
87
-
88
-
89
-
90
-
91
-
92
-
93
-
94
-
95
-
96
-
97
-
98
-
99
-
100
-
101
-
102
-
103
-
104
-
105
-
106
-
107
-
108
-
109
-
110
-
111
-
112
-
113
-
114
-
 115
115 -
 116
116 -
 117
117 -
 118
118 -
 119
119 -
 120
120 -
 121
121 -
 122
122 -
 123
123 -
 124
124 -
 125
125 -
 126
126 -
 127
127 -
 128
128 -
 129
129 -
 130
130 -
 131
131 -
 132
132 -
 133
133 -
 134
134 -
 135
135 -
136
-
137
-
138
-
139
-
140
-
141
-
142
-
143
-
144
-
145
-
146
-
147
-
148
-
149
-
150
-
151
 |
 |
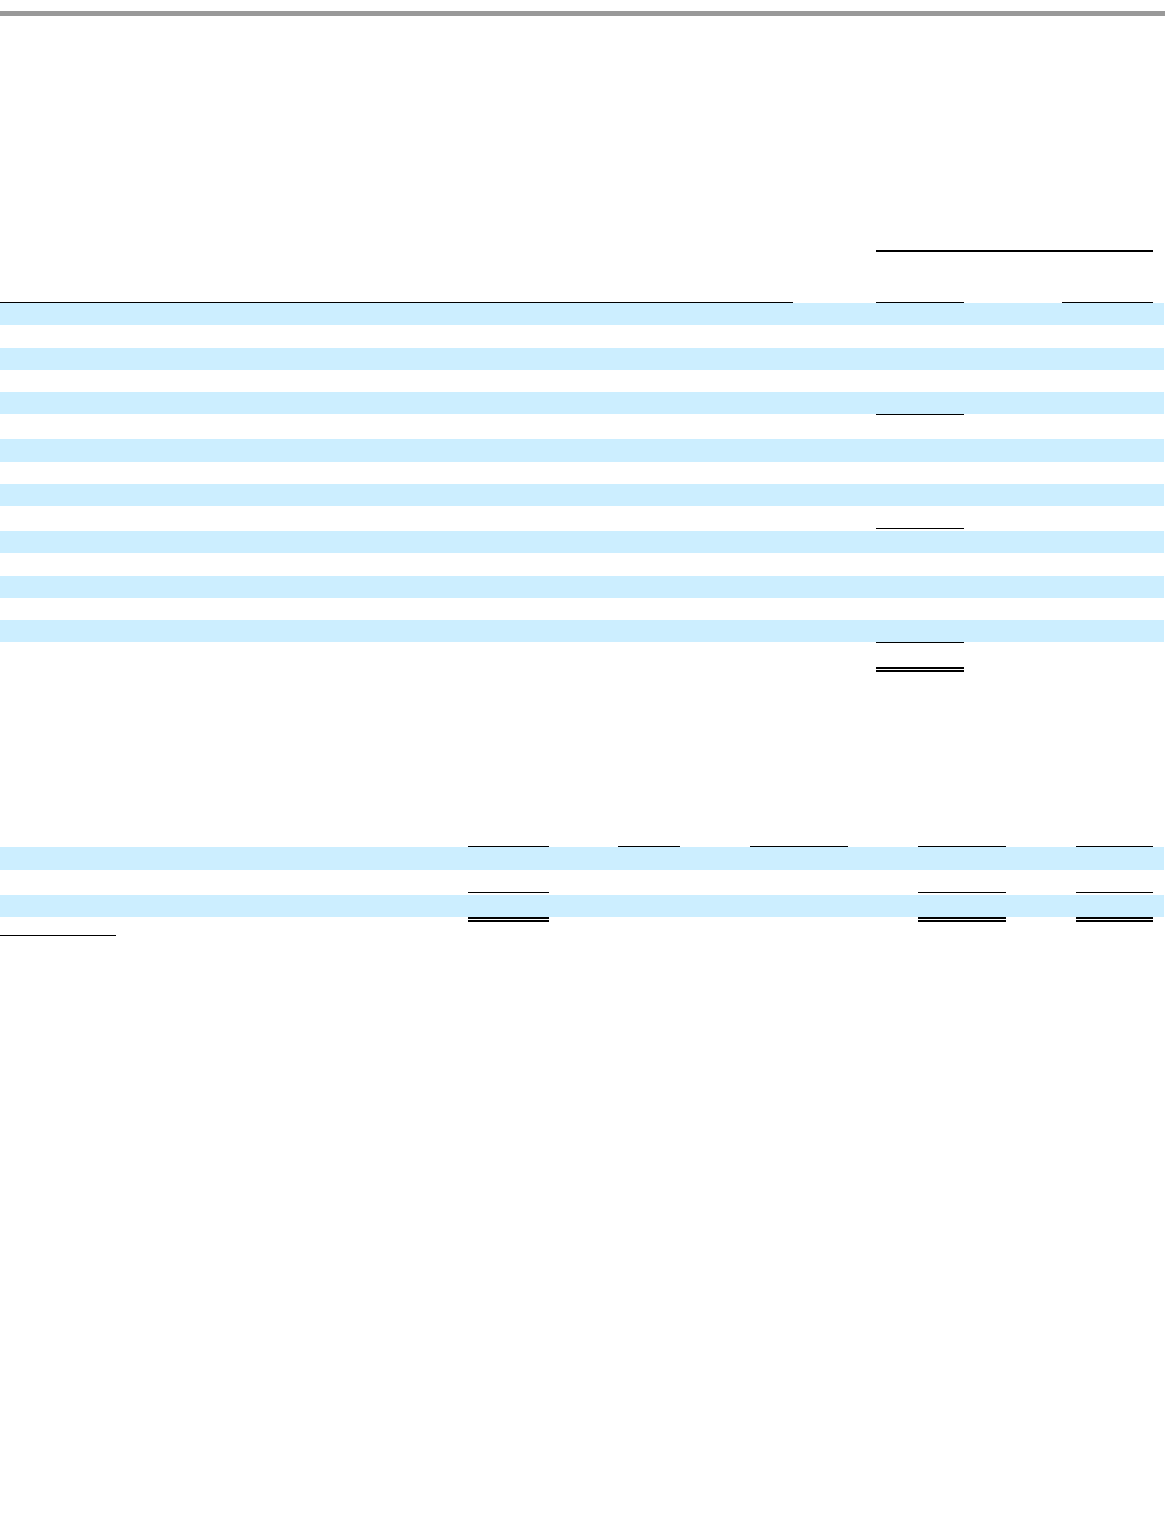
Table of Contents
ORACLE CORPORATION
NOTES TO CONSOLIDATED FINANCIAL STATEMENTS—(Continued)
May 31, 2014
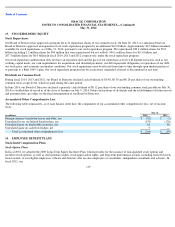
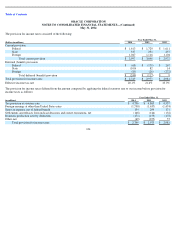
The following table summarizes stock option activity for our last three fiscal years ended May 31, 2014:
Options outstanding that have vested and that are expected to vest as of May 31, 2014 were as follows:
121
Options Outstanding
(in millions, except exercise price)
Shares Under
Option
Weighted
Average
Exercise Price
Balance, May 31, 2011
354
$
19.53
Granted
112
$
32.05
Assumed
8
$
12.17
Exercised
(39
)
$
16.61
Canceled
(13
)
$
29.31
Balance, May 31, 2012
422
$
22.66
Granted
119
$
29.90
Assumed
9
$
32.52
Exercised
(83
)
$
17.38
Canceled
(20
)
$
28.94
Balance, May 31, 2013
447
$
25.48
Granted
131
$
31.02
Assumed
5
$
9.02
Exercised
(95
)
$
21.51
Canceled
(26
)
$
30.60
Balance, May 31, 2014
462
$
27.37
Outstanding
Options
(in millions)
Weighted
Average
Exercise
Price
Weighted
Average
Remaining
Contract Term
(in years)
In
-
the
-
Money
Options as of
May 31, 2014
(in millions)
Aggregate
Intrinsic
Value
(in millions)
Vested
192
$
23.44
5.12
190
$
3,608
Expected to vest
241
$
30.07
8.19
241
2,885
Total
433
$
27.13
6.83
431
$
6,493
The aggregate intrinsic value was calculated based on the gross difference between our closing stock price on the last trading day of fiscal 2014 of $42.02 and the exercise prices for all
“
in
-
the
-
money
”
options outstanding, excluding tax effects.
The unrecognized compensation expense calculated under the fair value method for shares expected to vest (unvested shares net of expected forfeitures) as of May 31, 2014 was
approximately $1.2 billion and is expected to be recognized over a weighted average period of 2.51 years. Approximately 29 million shares outstanding as of May 31, 2014 were not
expected to vest.
(1)
(2)
(1)
(2)