Oracle 2013 Annual Report Download - page 64
Download and view the complete annual report
Please find page 64 of the 2013 Oracle annual report below. You can navigate through the pages in the report by either clicking on the pages listed below, or by using the keyword search tool below to find specific information within the annual report.-
 1
1 -
2
-
3
-
4
-
5
-
6
-
7
-
8
-
9
-
10
-
11
-
12
-
13
-
14
-
15
-
16
-
17
-
18
-
19
-
20
-
21
-
22
-
23
-
24
-
25
-
26
-
27
-
28
-
29
-
30
-
31
-
32
-
33
-
34
-
35
-
36
-
37
-
38
-
39
-
40
-
41
-
42
-
43
-
44
-
45
-
46
-
47
-
48
-
49
-
50
-
51
-
52
-
53
-
 54
54 -
 55
55 -
 56
56 -
 57
57 -
 58
58 -
 59
59 -
 60
60 -
 61
61 -
 62
62 -
 63
63 -
 64
64 -
 65
65 -
 66
66 -
 67
67 -
 68
68 -
 69
69 -
 70
70 -
 71
71 -
 72
72 -
 73
73 -
 74
74 -
75
-
76
-
77
-
78
-
79
-
80
-
81
-
82
-
83
-
84
-
85
-
86
-
87
-
88
-
89
-
90
-
91
-
92
-
93
-
94
-
95
-
96
-
97
-
98
-
99
-
100
-
101
-
102
-
103
-
104
-
105
-
106
-
107
-
108
-
109
-
110
-
111
-
112
-
113
-
114
-
115
-
116
-
117
-
118
-
119
-
120
-
121
-
122
-
123
-
124
-
125
-
126
-
127
-
128
-
129
-
130
-
131
-
132
-
133
-
134
-
135
-
136
-
137
-
138
-
139
-
140
-
141
-
142
-
143
-
144
-
145
-
146
-
147
-
148
-
149
-
150
-
151
 |
 |
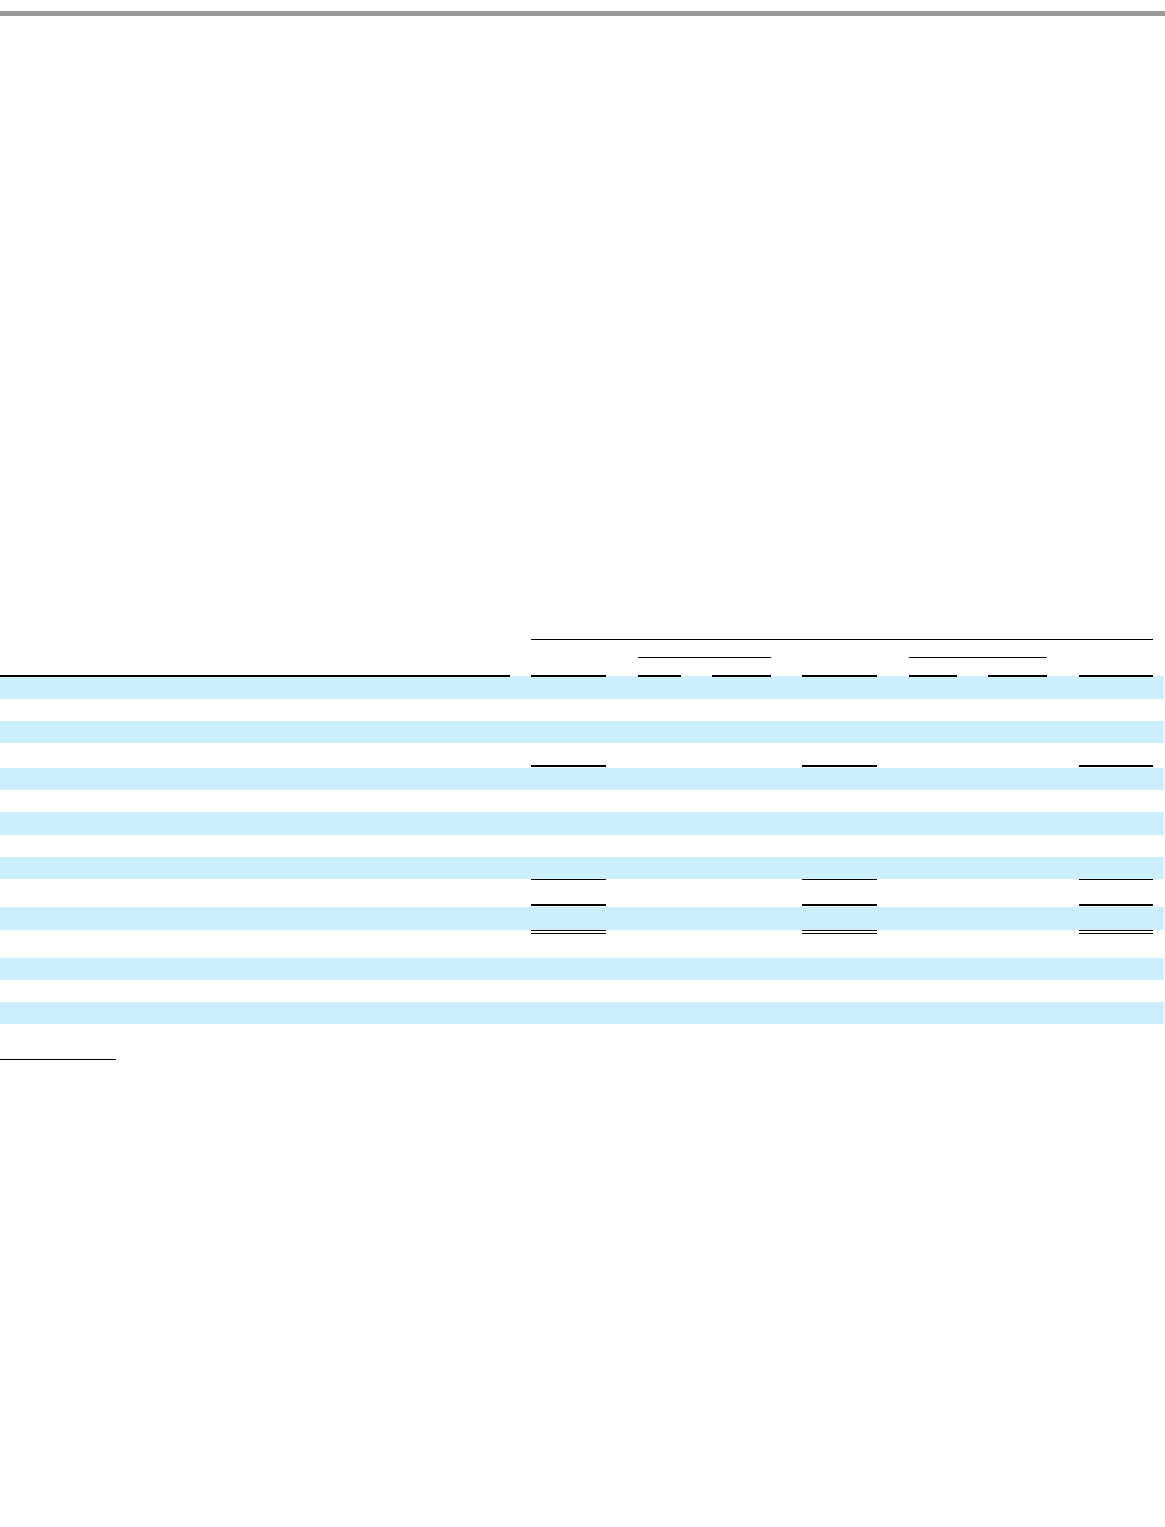
Table of Contents
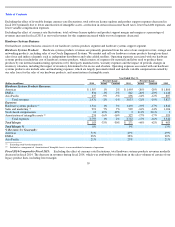
products, was partially offset by incremental revenues from our recently acquired companies and increases in hardware revenues attributable to
our sales of Oracle Engineered Systems.
In constant currency, total hardware systems products operating expenses increased in fiscal 2014 primarily due to an increase in employee
related expenses due primarily to an increase in sales and marketing headcount, partially offset by a decrease in amortization of intangible assets.
Excluding the effect of currency rate fluctuations, total margin and margin as a percentage of revenues decreased in fiscal 2014 due to a decrease
in our total revenues and increase in our total expenses for this segment.
Fiscal 2013 Compared to Fiscal 2012: On a constant currency basis, hardware systems products revenues decreased in fiscal 2013 primarily
due to reductions in the sales volumes of certain of our legacy product lines, including lower margin products. These revenue decreases were
partially offset by increases in hardware revenues attributable to our Oracle Engineered Systems.
On a constant currency basis, total hardware systems products operating expenses declined in fiscal 2013 primarily due to a reduction in
hardware systems products costs associated with lower hardware revenues, a decrease in employee related expenses due to decreased hardware
systems sales headcount, and lower intangible asset amortization.
Excluding the effect of currency rate fluctuations, total hardware systems products margin and margin as a percentage of revenues decreased in
fiscal 2013 as our total revenues for this segment decreased at a faster rate than our total expenses.
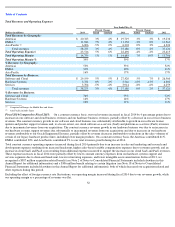
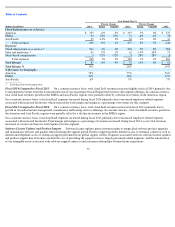
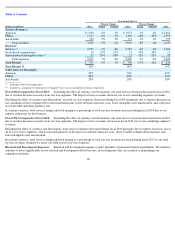
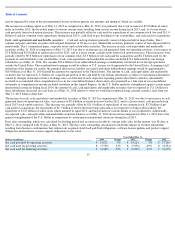
Hardware Systems Support:
Our hardware systems support offerings provide customers with software updates for software components that
are essential to the functionality of our server, storage and networking products, such as Oracle Solaris and certain other software products, and
can include product repairs, maintenance services and technical support services. Expenses associated with our hardware systems support
operating segment include the cost of materials used to repair customer products, the cost of providing support
services, largely personnel related
expenses, and the amortization of our intangible assets associated with hardware systems support contracts and customer relationships obtained
from our acquisitions.
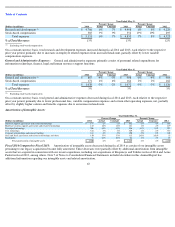
Fiscal 2014 Compared to Fiscal 2013: Excluding the impact of unfavorable currency rate fluctuations, hardware systems support revenues
increased in fiscal 2014 primarily due to incremental revenues from our
60
Year Ended May 31,
Percent Change
Percent Change
(Dollars in millions)
2014
Actual
Constant
2013
Actual
Constant
2012
Hardware Systems Support Revenues:
Americas
$
1,229
11%
12%
$
1,109
-
4%
-
4%
$
1,157
EMEA
738
-
2%
-
4%
752
-
14%
-
10%
870
Asia Pacific
429
-
5%
2%
452
1%
4%
448
Total revenues
2,396
4%
5%
2,313
-
7%
-
4%
2,475
Expenses:
Hardware systems support
830
-
6%
-
5%
885
-
15%
-
13%
1,041
Stock
-
based compensation
6
26%
26%
5
-
3%
-
3%
5
Amortization of intangible assets
231
8%
8%
213
-
30%
-
30%
305
Total expenses
1,067
-
3%
-
3%
1,103
-
18%
-
17%
1,351
Total Margin
$
1,329
10%
12%
$
1,210
8%
11%
$
1,124
Total Margin %
55%
52%
45%
% Revenues by Geography:
Americas
51%
48%
47%
EMEA
31%
32%
35%
Asia Pacific
18%
20%
18%
Excluding stock
-
based compensation
Included as a component of
‘
Amortization of Intangible Assets
’
in our consolidated statements of operations
(1)
(2)
(1)
(2)