Oracle 2013 Annual Report Download - page 61
Download and view the complete annual report
Please find page 61 of the 2013 Oracle annual report below. You can navigate through the pages in the report by either clicking on the pages listed below, or by using the keyword search tool below to find specific information within the annual report.-
 1
1 -
2
-
3
-
4
-
5
-
6
-
7
-
8
-
9
-
10
-
11
-
12
-
13
-
14
-
15
-
16
-
17
-
18
-
19
-
20
-
21
-
22
-
23
-
24
-
25
-
26
-
27
-
28
-
29
-
30
-
31
-
32
-
33
-
34
-
35
-
36
-
37
-
38
-
39
-
40
-
41
-
42
-
43
-
44
-
45
-
46
-
47
-
48
-
49
-
50
-
 51
51 -
 52
52 -
 53
53 -
 54
54 -
 55
55 -
 56
56 -
 57
57 -
 58
58 -
 59
59 -
 60
60 -
 61
61 -
 62
62 -
 63
63 -
 64
64 -
 65
65 -
 66
66 -
 67
67 -
 68
68 -
 69
69 -
 70
70 -
 71
71 -
72
-
73
-
74
-
75
-
76
-
77
-
78
-
79
-
80
-
81
-
82
-
83
-
84
-
85
-
86
-
87
-
88
-
89
-
90
-
91
-
92
-
93
-
94
-
95
-
96
-
97
-
98
-
99
-
100
-
101
-
102
-
103
-
104
-
105
-
106
-
107
-
108
-
109
-
110
-
111
-
112
-
113
-
114
-
115
-
116
-
117
-
118
-
119
-
120
-
121
-
122
-
123
-
124
-
125
-
126
-
127
-
128
-
129
-
130
-
131
-
132
-
133
-
134
-
135
-
136
-
137
-
138
-
139
-
140
-
141
-
142
-
143
-
144
-
145
-
146
-
147
-
148
-
149
-
150
-
151
 |
 |

Table of Contents
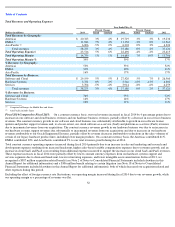
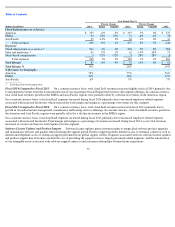
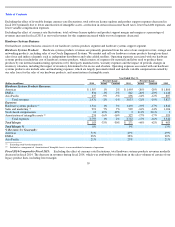
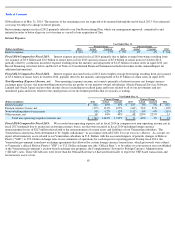
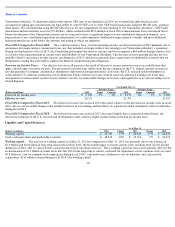
Fiscal 2014 Compared to Fiscal 2013: On a constant currency basis, total cloud IaaS revenues increased slightly in fiscal 2014 primarily due
to incremental revenues from the recent introduction of our on-premise Oracle Engineered Systems subscription offerings. In constant currency,
total cloud IaaS revenues growth in the EMEA and Asia Pacific regions were partially offset by a decline in revenues in the Americas region.
On a constant currency basis, total cloud IaaS expenses increased during fiscal 2014 primarily due to increased employee related expenses
associated with increased headcount, which reduced the total margin and margin as a percentage of revenues for this segment.
Fiscal 2013 Compared to Fiscal 2012: On a constant currency basis, total cloud IaaS revenues increased in fiscal 2013 primarily due to
growth in our infrastructure management, maintenance and hosting services offerings. In constant currency, total cloud IaaS revenues growth in
the Americas and Asia Pacific regions were partially offset by a decline in revenues in the EMEA region.
On a constant currency basis, total cloud IaaS expenses increased during fiscal 2013 primarily due to increased employee related expenses
associated with increased headcount. Total margin and margin as a percentage of revenues increased during fiscal 2013 as our total revenues
increased at a faster rate than our total expenses for this segment.
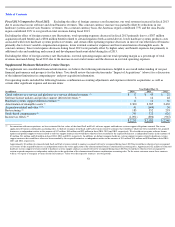
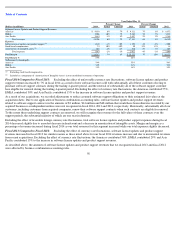
Software License Updates and Product Support:
Software license updates grant customers rights to unspecified software product upgrades
and maintenance releases and patches released during the support period. Product support includes internet access to technical content as well as
internet and telephone access to technical support personnel in our global support centers. Expenses associated with our software license updates
and product support line of business include the cost of providing the support services, largely personnel related expenses, and the amortization
of our intangible assets associated with software support contracts and customer relationships obtained from acquisitions.
57
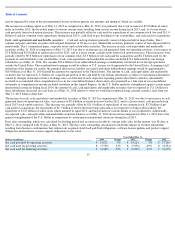
Year Ended May 31,
Percent Change
Percent Change
(Dollars in millions)
2014
Actual
Constant
2013
Actual
Constant
2012
Cloud Infastructure
-
as
-
a
-
Service:
Americas
$
335
-
6%
-
5%
$
355
5%
6%
$
337
EMEA
94
32%
27%
72
-
6%
-
1%
76
Asia Pacific
27
-
12%
3%
30
-
1%
4%
31
Total revenues
456
0%
1%
457
3%
5%
444
Expenses:
Cloud infastructure
-
as
-
a
-
service
304
3%
5%
296
5%
8%
283
Sales and marketing
61
0%
1%
61
-
15%
-
14%
72
Stock
-
based compensation
4
-
52%
-
52%
8
28%
28%
6
Total expenses
369
1%
3%
365
1%
4%
361
Total Margin
$
87
-
6%
-
9%
$
92
10%
8%
$
83
Total Margin %
19%
20%
19%
% Revenues by Geography:
Americas
73%
77%
76%
EMEA
21%
16%
17%
Asia Pacific
6%
7%
7%
Excluding stock
-
based compensation
(1)
(1)
(1)