Oracle 2013 Annual Report Download - page 112
Download and view the complete annual report
Please find page 112 of the 2013 Oracle annual report below. You can navigate through the pages in the report by either clicking on the pages listed below, or by using the keyword search tool below to find specific information within the annual report.-
 1
1 -
2
-
3
-
4
-
5
-
6
-
7
-
8
-
9
-
10
-
11
-
12
-
13
-
14
-
15
-
16
-
17
-
18
-
19
-
20
-
21
-
22
-
23
-
24
-
25
-
26
-
27
-
28
-
29
-
30
-
31
-
32
-
33
-
34
-
35
-
36
-
37
-
38
-
39
-
40
-
41
-
42
-
43
-
44
-
45
-
46
-
47
-
48
-
49
-
50
-
51
-
52
-
53
-
54
-
55
-
56
-
57
-
58
-
59
-
60
-
61
-
62
-
63
-
64
-
65
-
66
-
67
-
68
-
69
-
70
-
71
-
72
-
73
-
74
-
75
-
76
-
77
-
78
-
79
-
80
-
81
-
82
-
83
-
84
-
85
-
86
-
87
-
88
-
89
-
90
-
91
-
92
-
93
-
94
-
95
-
96
-
97
-
98
-
99
-
100
-
101
-
 102
102 -
 103
103 -
 104
104 -
 105
105 -
 106
106 -
 107
107 -
 108
108 -
 109
109 -
 110
110 -
 111
111 -
 112
112 -
 113
113 -
 114
114 -
 115
115 -
 116
116 -
 117
117 -
 118
118 -
 119
119 -
 120
120 -
 121
121 -
 122
122 -
123
-
124
-
125
-
126
-
127
-
128
-
129
-
130
-
131
-
132
-
133
-
134
-
135
-
136
-
137
-
138
-
139
-
140
-
141
-
142
-
143
-
144
-
145
-
146
-
147
-
148
-
149
-
150
-
151
 |
 |

Table of Contents
ORACLE CORPORATION
NOTES TO CONSOLIDATED FINANCIAL STATEMENTS—(Continued)
May 31, 2014
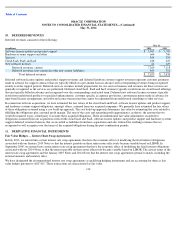
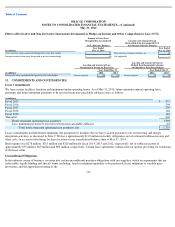
The changes in intangible assets for fiscal 2014 and the net book value of intangible assets at May 31, 2014 and 2013 were as follows:
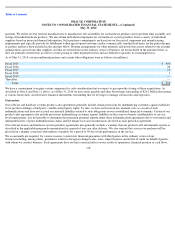
Total amortization expense related to our intangible assets was $2.3 billion in fiscal 2014 and $2.4 billion in each of fiscal 2013 and 2012. As of
May 31, 2014, estimated future amortization expenses related to intangible assets were as follows (in millions):
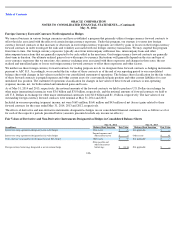
The changes in the carrying amounts of goodwill, which is generally not deductible for tax purposes, for our operating segments for fiscal 2014
and 2013 were as follows:
108
7.
INTANGIBLE ASSETS AND GOODWILL
Intangible Assets, Gross
Accumulated Amortization
Intangible Assets, Net
Weighted
Average
Useful Life
(Dollars in millions)
May 31,
2013
Additions
Retirements
May 31,
2014
May 31,
2013
Expense
Retirements
May 31,
2014
May 31,
2013
May 31,
2014
Software support agreements and related
relationships
$
5,298
$
—
$
(
80
)
$
5,218
$
(3,912
)
$
(571
)
$
80
$
(4,403
)
$
1,386
$
815
N.A.
Hardware systems support agreements and
related relationships
817
152
—
969
(387
)
(143
)
—
(
530
)
430
439
9 years
Developed technology
7,466
928
(4,007
)
4,387
(5,477
)
(706
)
4,007
(2,176
)
1,989
2,211
7 years
Core technology
2,579
—
(
962
)
1,617
(1,938
)
(318
)
962
(1,294
)
641
323
N.A.
Customer relationships and contract backlog
2,435
131
(512
)
2,054
(1,637
)
(334
)
512
(1,459
)
798
595
4 years
SaaS and PaaS agreements and related
relationships and other
1,227
562
—
1,789
(155
)
(150
)
—
(
305
)
1,072
1,484
10 years
Trademarks
635
39
(158
)
516
(356
)
(78
)
158
(276
)
279
240
10 years
Total intangible assets subject to
amortization
20,457
1,812
(5,719
)
16,550
(13,862
)
(2,300
)
5,719
(10,443
)
6,595
6,107
8 years
In
-
process research and development, net
45
(15
)
—
30
—
—
—
—
45
30
N.A.
Total intangible assets, net
$
20,502
$
1,797
$
(5,719
)
$
16,580
$
(13,862
)
$
(2,300
)
$
5,719
$
(10,443
)
$
6,640
$
6,137
Represents weighted average useful lives of intangible assets acquired during fiscal 2014.
Fiscal 2015
$
1,934
Fiscal 2016
1,337
Fiscal 2017
741
Fiscal 2018
607
Fiscal 2019
508
Thereafter
980
Total intangible assets subject to amortization
6,107
In
-
process research and development
30
Total intangible assets, net
$
6,137
(Dollars in millions)
New Software
Licenses and
Cloud
Software
Subscriptions
Software
License
Updates and
Product
Support
Hardware
Systems
Support
Other
Total
Balances as of May 31, 2012
$
7,367
$
12,479
$
1,193
$
4,080
$
25,119
Allocation of goodwill
2,346
—
—
(
2,346
)
—
Goodwill from acquisitions
933
27
62
1,341
2,363
Goodwill adjustments
(113
)
(32
)
4
2
(139
)
Balances as of May 31, 2013
10,533
12,474
1,259
3,077
27,343
Allocation of goodwill
875
—
380
(1,255
)
—
Goodwill from acquisitions
1,721
4
436
134
2,295
Goodwill adjustments
10
(6
)
7
3
14
Balances as of May 31, 2014
$
13,139
$
12,472
$
2,082
$
1,959
$
29,652
(1)
(1)
(3)
(1)
(2)
(1)
(2)