Oracle 2013 Annual Report Download - page 58
Download and view the complete annual report
Please find page 58 of the 2013 Oracle annual report below. You can navigate through the pages in the report by either clicking on the pages listed below, or by using the keyword search tool below to find specific information within the annual report.-
 1
1 -
2
-
3
-
4
-
5
-
6
-
7
-
8
-
9
-
10
-
11
-
12
-
13
-
14
-
15
-
16
-
17
-
18
-
19
-
20
-
21
-
22
-
23
-
24
-
25
-
26
-
27
-
28
-
29
-
30
-
31
-
32
-
33
-
34
-
35
-
36
-
37
-
38
-
39
-
40
-
41
-
42
-
43
-
44
-
45
-
46
-
47
-
 48
48 -
 49
49 -
 50
50 -
 51
51 -
 52
52 -
 53
53 -
 54
54 -
 55
55 -
 56
56 -
 57
57 -
 58
58 -
 59
59 -
 60
60 -
 61
61 -
 62
62 -
 63
63 -
 64
64 -
 65
65 -
 66
66 -
 67
67 -
 68
68 -
69
-
70
-
71
-
72
-
73
-
74
-
75
-
76
-
77
-
78
-
79
-
80
-
81
-
82
-
83
-
84
-
85
-
86
-
87
-
88
-
89
-
90
-
91
-
92
-
93
-
94
-
95
-
96
-
97
-
98
-
99
-
100
-
101
-
102
-
103
-
104
-
105
-
106
-
107
-
108
-
109
-
110
-
111
-
112
-
113
-
114
-
115
-
116
-
117
-
118
-
119
-
120
-
121
-
122
-
123
-
124
-
125
-
126
-
127
-
128
-
129
-
130
-
131
-
132
-
133
-
134
-
135
-
136
-
137
-
138
-
139
-
140
-
141
-
142
-
143
-
144
-
145
-
146
-
147
-
148
-
149
-
150
-
151
 |
 |

Table of Contents
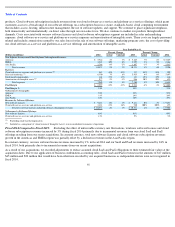
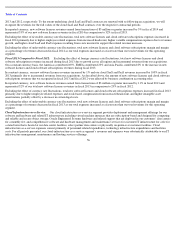
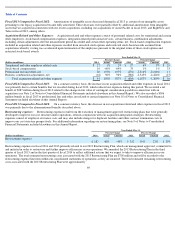
Software and Cloud Business
Our software and cloud business consists of our new software licenses and cloud software subscriptions segment, our cloud infrastructure-as-a-
service segment and our software license updates and product support segment.
New Software Licenses and Cloud Software Subscriptions:
New software licenses revenues represent fees earned from granting customers
licenses to use our database and middleware and our application software
54
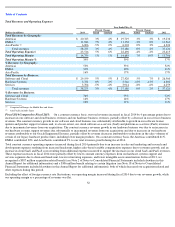
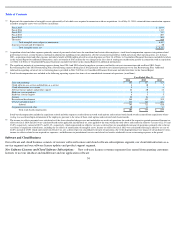
Represents the amortization of intangible assets substantially all of which were acquired in connection with our acquisitions. As of May 31, 2014, estimated future amortization expenses
related to intangible assets were as follows (in millions):
Fiscal 2015
$
1,934
Fiscal 2016
1,337
Fiscal 2017
741
Fiscal 2018
607
Fiscal 2019
508
Thereafter
980
Total intangible assets subject to amortization
6,107
In
-
process research and development
30
Total intangible assets, net
$
6,137
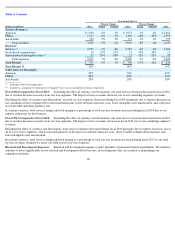
Acquisition related and other expenses primarily consist of personnel related costs for transitional and certain other employees, stock-based compensation expenses, integration related
professional services, certain business combination adjustments including certain adjustments after the measurement period has ended and certain other operating items, net. In fiscal
2013, acquisition related and other expenses included a benefit of $306 million related to certain litigation (see Note 18 of Notes to Consolidated Financial Statements included elsewhere
in this Annual Report for additional information), and a net benefit of $387 million due to a change in the fair value of contingent consideration payable in connection with an acquisition
(see Note 2 of Notes to Consolidated Financial Statements included elsewhere in this Annual Report for additional information).
The significant majority of restructuring expenses during fiscal 2014 and 2013 related to employee severance and facility exit costs in connection with our Fiscal 2013 Oracle
Restructuring Plan (the 2013 Restructuring Plan). Restructuring expenses during fiscal 2012 primarily related to costs incurred pursuant to our Sun Restructuring Plan. Additional
information regarding certain of our restructuring plans is provided in Note 9 of Notes to Consolidated Financial Statements included elsewhere in this Annual Report.
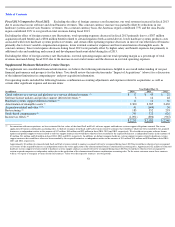
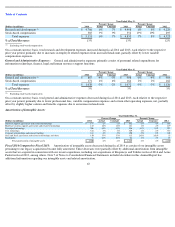
Stock
-
based compensation was included in the following operating expense line items of our consolidated statements of operations (in millions):
Year Ended May 31,
2014
2013
2012
Sales and marketing
$
165
$
137
$
115
Cloud software
-
as
-
a
-
service and platform
-
as
-
a
-
service
8
10
7
Cloud infrastructure
-
as
-
a
-
service
4
8
6
Software license updates and product support
22
20
18
Hardware systems products
5
3
1
Hardware systems support
6
5
5
Services
29
23
17
Research and development
385
352
295
General and administrative
171
164
162
Subtotal
795
722
626
Acquisition related and other
10
33
33
Total stock
-
based compensation
$
805
$
755
$
659
Stock-based compensation included in acquisition related and other expenses resulted from unvested stock options and restricted stock-based awards assumed from acquisitions whose
vesting was accelerated upon termination of the employees pursuant to the terms of those stock options and restricted stock
-
based awards.
The income tax effects presented were calculated as if the above described charges were not included in our results of operations for each of the respective periods presented. Income tax
effects for fiscal 2014 and 2013 were calculated based on the applicable jurisdictional tax rates applied to the items within the table above and resulted in effective tax rates of 22.5% and
23.0%, respectively, instead of 20.1% and 21.4%, respectively, which represented our effective tax rates as derived per our consolidated statement of operations, primarily due to the net
tax effects of acquisition related items, including the tax effects of amortization of intangible assets. Income tax effects for fiscal 2012 were calculated reflecting an effective tax rate of
24.0%, instead of 23.0% which represented our effective tax rate as derived per our consolidated statement of operations, due to the disproportionate rate impact of certain discrete items,
income tax effects related to our acquired tax exposures, and differences in jurisdictional tax rates and related tax benefits attributable to our restructuring expenses in the period.
(2)
(3)
(4)
(5)
(6)