Oracle 2013 Annual Report Download - page 66
Download and view the complete annual report
Please find page 66 of the 2013 Oracle annual report below. You can navigate through the pages in the report by either clicking on the pages listed below, or by using the keyword search tool below to find specific information within the annual report.-
 1
1 -
2
-
3
-
4
-
5
-
6
-
7
-
8
-
9
-
10
-
11
-
12
-
13
-
14
-
15
-
16
-
17
-
18
-
19
-
20
-
21
-
22
-
23
-
24
-
25
-
26
-
27
-
28
-
29
-
30
-
31
-
32
-
33
-
34
-
35
-
36
-
37
-
38
-
39
-
40
-
41
-
42
-
43
-
44
-
45
-
46
-
47
-
48
-
49
-
50
-
51
-
52
-
53
-
54
-
55
-
 56
56 -
 57
57 -
 58
58 -
 59
59 -
 60
60 -
 61
61 -
 62
62 -
 63
63 -
 64
64 -
 65
65 -
 66
66 -
 67
67 -
 68
68 -
 69
69 -
 70
70 -
 71
71 -
 72
72 -
 73
73 -
 74
74 -
 75
75 -
 76
76 -
77
-
78
-
79
-
80
-
81
-
82
-
83
-
84
-
85
-
86
-
87
-
88
-
89
-
90
-
91
-
92
-
93
-
94
-
95
-
96
-
97
-
98
-
99
-
100
-
101
-
102
-
103
-
104
-
105
-
106
-
107
-
108
-
109
-
110
-
111
-
112
-
113
-
114
-
115
-
116
-
117
-
118
-
119
-
120
-
121
-
122
-
123
-
124
-
125
-
126
-
127
-
128
-
129
-
130
-
131
-
132
-
133
-
134
-
135
-
136
-
137
-
138
-
139
-
140
-
141
-
142
-
143
-
144
-
145
-
146
-
147
-
148
-
149
-
150
-
151
 |
 |

Table of Contents
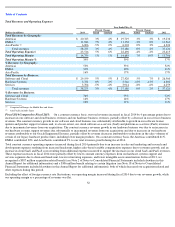
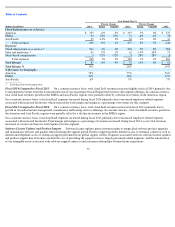
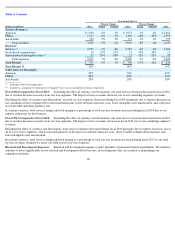
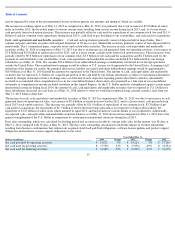
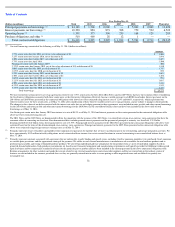
Fiscal 2014 Compared to Fiscal 2013: Excluding the effect of currency rate fluctuations, our total services revenues decreased in fiscal 2014
due to revenue decreases in each of our services segments. The largest services revenues decrease was to our consulting segment’s revenues.
Excluding the effect of currency rate fluctuations, our total services expenses decreased during fiscal 2014 primarily due to expense decreases in
our consulting services segment due to decreased headcount, lower external contractor costs, lower intangible asset amortization, and a decrease
in certain other operating expenses, net.
In constant currency, total services margin and total margin as a percentage of total services revenues increased during fiscal 2014 due to our
expense reductions for this business.
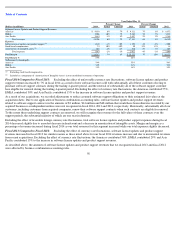
Fiscal 2013 Compared to Fiscal 2012: Excluding the effect of currency rate fluctuations, our total services revenues decreased in fiscal 2013
due to revenue decreases in each of our services segments. The largest services revenues decrease in fiscal 2013 was to our consulting segment’
s
revenues.
Excluding the effect of currency rate fluctuations, total services expenses decreased during fiscal 2013 primarily due to expense decreases across
all of our services segments, which consisted primarily of decreases in external contractor costs, lower variable compensation expenses, and
lower intangible asset amortization.
In constant currency, total services margin and total margin as a percentage of total services revenues decreased during fiscal 2013 as our total
services revenues declined at a faster rate than our total services expenses.
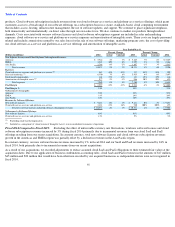
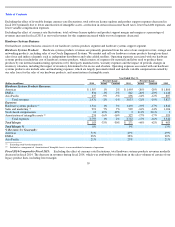
Research and Development Expenses:
Research and development expenses consist primarily of personnel related expenditures. We intend to
continue to invest significantly in our research and development efforts because, in our judgment, they are essential to maintaining our
competitive position.
62
Year Ended May 31,
Percent Change
Percent Change
(Dollars in millions)
2014
Actual
Constant
2013
Actual
Constant
2012
Services Revenues:
Americas
$
1,850
-
6%
-
5%
$
1,973
-
5%
-
4%
$
2,083
EMEA
1,125
-
4%
-
7%
1,170
-
16%
-
13%
1,397
Asia Pacific
729
-
5%
2%
771
-
1%
4%
779
Total revenues
3,704
-
5%
-
4%
3,914
-
8%
-
6%
4,259
Expenses:
Services
2,925
-
7%
-
6%
3,159
-
6%
-
4%
3,365
Stock
-
based compensation
29
25%
25%
23
39%
39%
17
Amortization of intangible assets
17
-
26%
-
26%
23
-
52%
-
52%
47
Total expenses
2,971
-
7%
-
6%
3,205
-
7%
-
4%
3,429
Total Margin
$
733
3%
5%
$
709
-
15%
-
12%
$
830
Total Margin %
20%
18%
19%
% Revenues by Geography:
Americas
50%
50%
49%
EMEA
30%
30%
33%
Asia Pacific
20%
20%
18%
Excluding stock
-
based compensation
Included as a component of
‘
Amortization of Intangible Assets
’
in our consolidated statements of operations
(1)
(2)
(1)
(2)