Oracle 2013 Annual Report Download - page 133
Download and view the complete annual report
Please find page 133 of the 2013 Oracle annual report below. You can navigate through the pages in the report by either clicking on the pages listed below, or by using the keyword search tool below to find specific information within the annual report.-
 1
1 -
2
-
3
-
4
-
5
-
6
-
7
-
8
-
9
-
10
-
11
-
12
-
13
-
14
-
15
-
16
-
17
-
18
-
19
-
20
-
21
-
22
-
23
-
24
-
25
-
26
-
27
-
28
-
29
-
30
-
31
-
32
-
33
-
34
-
35
-
36
-
37
-
38
-
39
-
40
-
41
-
42
-
43
-
44
-
45
-
46
-
47
-
48
-
49
-
50
-
51
-
52
-
53
-
54
-
55
-
56
-
57
-
58
-
59
-
60
-
61
-
62
-
63
-
64
-
65
-
66
-
67
-
68
-
69
-
70
-
71
-
72
-
73
-
74
-
75
-
76
-
77
-
78
-
79
-
80
-
81
-
82
-
83
-
84
-
85
-
86
-
87
-
88
-
89
-
90
-
91
-
92
-
93
-
94
-
95
-
96
-
97
-
98
-
99
-
100
-
101
-
102
-
103
-
104
-
105
-
106
-
107
-
108
-
109
-
110
-
111
-
112
-
113
-
114
-
115
-
116
-
117
-
118
-
119
-
120
-
121
-
122
-
 123
123 -
 124
124 -
 125
125 -
 126
126 -
 127
127 -
 128
128 -
 129
129 -
 130
130 -
 131
131 -
 132
132 -
 133
133 -
 134
134 -
 135
135 -
 136
136 -
 137
137 -
 138
138 -
 139
139 -
 140
140 -
 141
141 -
 142
142 -
 143
143 -
144
-
145
-
146
-
147
-
148
-
149
-
150
-
151
 |
 |

Table of Contents
ORACLE CORPORATION
NOTES TO CONSOLIDATED FINANCIAL STATEMENTS—(Continued)
May 31, 2014
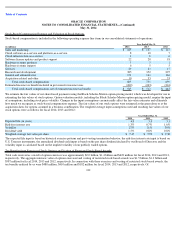
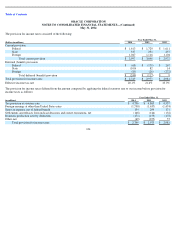
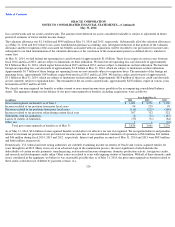
The following table presents summary results for each of our three businesses and for the operating segments of our software and hardware
systems businesses:
129
Year Ended May 31,
(in millions)
2014
2013
2012
New software licenses and cloud software subscriptions:
Revenues
$
10,542
$
10,350
$
9,910
Cloud software
-
as
-
a
-
service and platform
-
as
-
a
-
service expenses
437
313
199
Sales and distribution expenses
5,666
5,227
5,018
Margin
$
4,439
$
4,810
$
4,693
Cloud infrastructure
-
as
-
a
-
service:
Revenues
$
491
$
491
$
483
Cloud infrastructure
-
as
-
a
-
service expenses
310
300
288
Sales and distribution expenses
62
61
72
Margin
$
119
$
130
$
123
Software license updates and product support:
Revenues
$
18,209
$
17,156
$
16,258
Software license updates and product support expenses
1,111
1,120
1,159
Margin
$
17,098
$
16,036
$
15,099
Total software and cloud business:
Revenues
$
29,242
$
27,997
$
26,651
Expenses
7,586
7,021
6,736
Margin
$
21,656
$
20,976
$
19,915
Hardware systems products:
Revenues
$
2,976
$
3,033
$
3,827
Hardware systems products expenses
1,516
1,498
1,841
Sales and distribution expenses
940
885
1,050
Margin
$
520
$
650
$
936
Hardware systems support:
Revenues
$
2,407
$
2,327
$
2,505
Hardware systems support expenses
802
857
1,006
Margin
$
1,605
$
1,470
$
1,499
Total hardware systems business:
Revenues
$
5,383
$
5,360
$
6,332
Expenses
3,258
3,240
3,897
Margin
$
2,125
$
2,120
$
2,435
Total services business:
Revenues
$
3,681
$
3,896
$
4,238
Services expenses
2,815
3,047
3,248
Margin
$
866
$
849
$
990
Totals:
Revenues
$
38,306
$
37,253
$
37,221
Expenses
13,659
13,308
13,881
Margin
$
24,647
$
23,945
$
23,340
New software licenses and cloud software subscriptions revenues for management reporting included revenues related to cloud SaaS and PaaS contracts that would have otherwise been
recorded by the acquired businesses as independent entities but were not recognized in
(1)
(2)
(2)
(1)
(2)
(1)
(2)
(2)
(1)
(2)
(1)
(2)
(1)
(2)
(1)
(2)
(1)