NetFlix 2013 Annual Report Download - page 74
Download and view the complete annual report
Please find page 74 of the 2013 NetFlix annual report below. You can navigate through the pages in the report by either clicking on the pages listed below, or by using the keyword search tool below to find specific information within the annual report.-
 1
1 -
2
-
3
-
4
-
5
-
6
-
7
-
8
-
9
-
10
-
11
-
12
-
13
-
14
-
15
-
16
-
17
-
18
-
19
-
20
-
21
-
22
-
23
-
24
-
25
-
26
-
27
-
28
-
29
-
30
-
31
-
32
-
33
-
34
-
35
-
36
-
37
-
38
-
39
-
40
-
41
-
42
-
43
-
44
-
45
-
46
-
47
-
48
-
49
-
50
-
51
-
52
-
53
-
54
-
55
-
56
-
57
-
58
-
59
-
60
-
61
-
62
-
63
-
 64
64 -
 65
65 -
 66
66 -
 67
67 -
 68
68 -
 69
69 -
 70
70 -
 71
71 -
 72
72 -
 73
73 -
 74
74 -
 75
75 -
 76
76 -
 77
77 -
 78
78
 |
 |

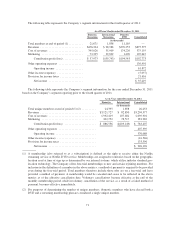
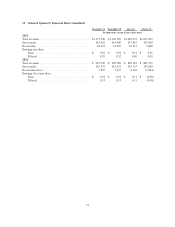
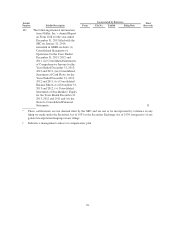
13. Selected Quarterly Financial Data (Unaudited)
December 31 September 30 June 30 March 31
(in thousands, except for per share data)
2013
Total revenues .................................. $1,175,230 $1,105,999 $1,069,372 $1,023,961
Gross profit ..................................... 363,381 314,980 315,847 297,098
Net income ..................................... 48,421 31,822 29,471 2,689
Earnings per share:
Basic ...................................... $ 0.81 $ 0.54 $ 0.51 $ 0.05
Diluted .................................... 0.79 0.52 0.49 0.05
2012
Total revenues .................................. $ 945,239 $ 905,089 $ 889,163 $ 869,791
Gross profit ..................................... 249,372 242,451 245,735 245,858
Net income (loss) ................................ 7,897 7,675 6,164 (4,584)
Earnings (loss) per share:
Basic ...................................... $ 0.14 $ 0.14 $ 0.11 $ (0.08)
Diluted .................................... 0.13 0.13 0.11 (0.08)
72