NetFlix 2013 Annual Report Download - page 66
Download and view the complete annual report
Please find page 66 of the 2013 NetFlix annual report below. You can navigate through the pages in the report by either clicking on the pages listed below, or by using the keyword search tool below to find specific information within the annual report.-
 1
1 -
2
-
3
-
4
-
5
-
6
-
7
-
8
-
9
-
10
-
11
-
12
-
13
-
14
-
15
-
16
-
17
-
18
-
19
-
20
-
21
-
22
-
23
-
24
-
25
-
26
-
27
-
28
-
29
-
30
-
31
-
32
-
33
-
34
-
35
-
36
-
37
-
38
-
39
-
40
-
41
-
42
-
43
-
44
-
45
-
46
-
47
-
48
-
49
-
50
-
51
-
52
-
53
-
54
-
55
-
 56
56 -
 57
57 -
 58
58 -
 59
59 -
 60
60 -
 61
61 -
 62
62 -
 63
63 -
 64
64 -
 65
65 -
 66
66 -
 67
67 -
 68
68 -
 69
69 -
 70
70 -
 71
71 -
 72
72 -
 73
73 -
 74
74 -
 75
75 -
 76
76 -
77
-
78
 |
 |

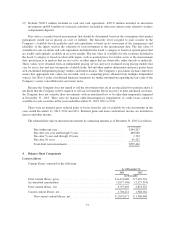
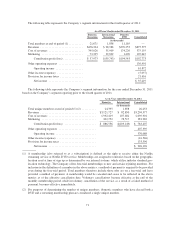
The aggregate intrinsic value in the table above represents the total pretax intrinsic value (the difference
between the Company’s closing stock price on the last trading day of 2013 and the exercise price, multiplied by
the number of in-the-money options) that would have been received by the option holders had all option holders
exercised their options on December 31, 2013. This amount changes based on the fair market value of the
Company’s common stock. Total intrinsic value of options exercised for the years ended December 31, 2013,
2012 and 2011 was $274.2 million, $14.7 million and $128.1 million, respectively.
Cash received from option exercises for the years ended December 31, 2013, 2012 and 2011 was
$124.6 million, $4.1 million and $19.6 million, respectively.
Employee Stock Purchase Plan
In February 2002, the Company adopted the 2002 ESPP under which employees purchased common stock
of the Company through accumulated payroll deductions. The purchase price of the common stock acquired by
the employees participating in the ESPP is 85% of the closing price on either the first day of the offering period
or the last day of the purchase period, whichever was lower. Under the ESPP, the offering and purchase periods
took place concurrently in consecutive six month increments. Therefore, the look-back for determining the
purchase price was six months. Employees could invest up to 15% of their gross compensation through payroll
deductions. In no event was an employee permitted to purchase more than 8,334 shares of common stock during
any six-month purchase period.
As of December 31, 2013, there were 2,785,721 shares available for future issuance under the 2002
Employee Stock Purchase Plan. The Company’s ESPP was suspended in 2011 and there were no offerings
subsequent to 2011.
Stock-Based Compensation
Vested stock options granted before June 30, 2004 can be exercised up to three months following
termination of employment. Vested stock options granted after June 30, 2004 and before January 1, 2007 can be
exercised up to one year following termination of employment. Vested stock options granted after January 2007
will remain exercisable for the full ten year contractual term regardless of employment status. The following
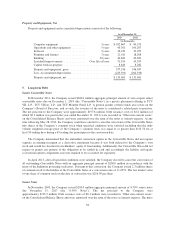
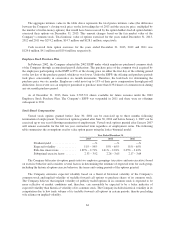
table summarizes the assumptions used to value option grants using the lattice-binomial model:
Year Ended December 31,
2013 2012 2011
Dividend yield ................. —% —% —%
Expected volatility ............. 51%–54% 55%–65% 51%–65%
Risk-free interest rate ........... 1.87% – 2.71% 1.61% – 2.01% 2.05% – 3.42%
Suboptimal exercise factor ....... 2.33 – 3.92 2.26 – 3.65 2.17 – 3.64
The Company bifurcates its option grants into two employee groupings (executive and non-executive) based
on exercise behavior and considers several factors in determining the estimate of expected term for each group,
including the historical option exercise behavior, the terms and vesting periods of the options granted.
The Company estimates expected volatility based on a blend of historical volatility of the Company’s
common stock and implied volatility of tradable forward call options to purchase shares of its common stock.
The Company believes that implied volatility of publicly traded options in its common stock is expected to be
more reflective of market conditions and, therefore, can reasonably be expected to be a better indicator of
expected volatility than historical volatility of its common stock. The Company includes historical volatility in its
computation due to low trade volume of its tradable forward call options in certain periods, thereby precluding
sole reliance on implied volatility.
64