NetFlix 2013 Annual Report Download - page 52
Download and view the complete annual report
Please find page 52 of the 2013 NetFlix annual report below. You can navigate through the pages in the report by either clicking on the pages listed below, or by using the keyword search tool below to find specific information within the annual report.-
 1
1 -
2
-
3
-
4
-
5
-
6
-
7
-
8
-
9
-
10
-
11
-
12
-
13
-
14
-
15
-
16
-
17
-
18
-
19
-
20
-
21
-
22
-
23
-
24
-
25
-
26
-
27
-
28
-
29
-
30
-
31
-
32
-
33
-
34
-
35
-
36
-
37
-
38
-
39
-
40
-
41
-
 42
42 -
 43
43 -
 44
44 -
 45
45 -
 46
46 -
 47
47 -
 48
48 -
 49
49 -
 50
50 -
 51
51 -
 52
52 -
 53
53 -
 54
54 -
 55
55 -
 56
56 -
 57
57 -
 58
58 -
 59
59 -
 60
60 -
 61
61 -
 62
62 -
63
-
64
-
65
-
66
-
67
-
68
-
69
-
70
-
71
-
72
-
73
-
74
-
75
-
76
-
77
-
78
 |
 |

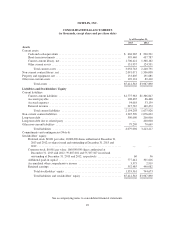
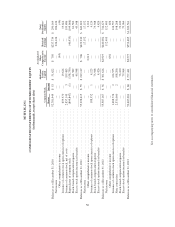
NETFLIX, INC.
CONSOLIDATED STATEMENTS OF STOCKHOLDERS’ EQUITY
(in thousands, except share data)
Common Stock
Additional
Paid-in
Capital
Accumulated
Other
Comprehensive
Income
Retained
Earnings
Total
Stockholders’
Equity
Shares Amount
Balances as of December 31, 2010 .................................. 52,781,949 $ 53 $ 51,622 $ 750 $237,739 $ 290,164
Net income ................................................. — — — — 226,126 226,126
Other comprehensive income .............................. — — — (44) — (44)
Issuance of common stock upon exercise of options ................. 659,370 — 19,614 — — 19,614
Issuance of common stock, net of costs ........................... 2,857,143 3 199,483 — — 199,486
Repurchases of common stock ................................. (899,847) (1) (158,730) — (40,935) (199,666)
Stock-based compensation expense .............................. — — 61,582 — — 61,582
Excess stock option income tax benefits .......................... — — 45,548 — — 45,548
Balances as of December 31, 2011 .................................. 55,398,615 $ 55 $ 219,119 $ 706 $422,930 $ 642,810
Net income ................................................. — — — — 17,152 17,152
Other comprehensive income .............................. — — — 2,213 — 2,213
Issuance of common stock upon exercise of options ................. 188,552 1 4,123 — — 4,124
Stock-based compensation expense .............................. — — 73,948 — — 73,948
Excess stock option income tax benefits .......................... — — 4,426 — — 4,426
Balances as of December 31, 2012 .................................. 55,587,167 $ 56 $ 301,616 $2,919 $440,082 $ 744,673
Net income ................................................. — — — — 112,403 112,403
Other comprehensive income .............................. — — — 656 — 656
Issuance of common stock upon exercise of options ................. 1,688,774 2 124,555 — — 124,557
Note conversion ............................................. 2,331,060 2 198,206 — — 198,208
Stock-based compensation expense .............................. — — 73,100 — — 73,100
Excess stock option income tax benefits .......................... — — 79,964 — — 79,964
Balances as of December 31, 2013 .................................. 59,607,001 $ 60 $ 777,441 $3,575 $552,485 $1,333,561
See accompanying notes to consolidated financial statements.
50