NetFlix 2013 Annual Report Download - page 72
Download and view the complete annual report
Please find page 72 of the 2013 NetFlix annual report below. You can navigate through the pages in the report by either clicking on the pages listed below, or by using the keyword search tool below to find specific information within the annual report.-
 1
1 -
2
-
3
-
4
-
5
-
6
-
7
-
8
-
9
-
10
-
11
-
12
-
13
-
14
-
15
-
16
-
17
-
18
-
19
-
20
-
21
-
22
-
23
-
24
-
25
-
26
-
27
-
28
-
29
-
30
-
31
-
32
-
33
-
34
-
35
-
36
-
37
-
38
-
39
-
40
-
41
-
42
-
43
-
44
-
45
-
46
-
47
-
48
-
49
-
50
-
51
-
52
-
53
-
54
-
55
-
56
-
57
-
58
-
59
-
60
-
61
-
 62
62 -
 63
63 -
 64
64 -
 65
65 -
 66
66 -
 67
67 -
 68
68 -
 69
69 -
 70
70 -
 71
71 -
 72
72 -
 73
73 -
 74
74 -
 75
75 -
 76
76 -
 77
77 -
 78
78
 |
 |

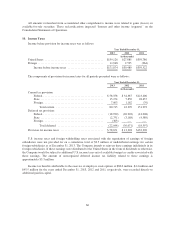
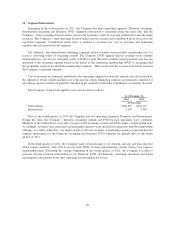
The following tables represent segment information for the year ended December 31, 2013:
As of/Year ended December 31, 2013
Domestic
Streaming
International
Streaming
Domestic
DVD Consolidated
(in thousands)
Total members at end of period (1) ........ 33,420 10,930 6,930 —
Revenues ............................ $2,751,375 $ 712,390 $910,797 $4,374,562
Cost of revenues ....................... 1,849,154 774,753 459,349 3,083,256
Marketing ............................ 279,454 211,969 12,466 503,889
Contribution profit (loss) ............ $ 622,767 $(274,332) $438,982 $ 787,417
Other operating expenses ................ 559,070
Operating income .................. 228,347
Other income (expense) ................. (57,273)
Provision for income taxes ............... 58,671
Net income ....................... $ 112,403
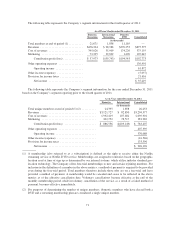
As of/Year ended December 31, 2013
Domestic
Streaming
International
Streaming
Domestic
DVD Consolidated
(in thousands)
Total content library, net ................. $2,973,023 $804,690 $19,779 $3,797,492
Amortization of content library ............ 1,420,076 701,905 71,325 2,193,306
The following tables represent segment information for the year ended December 31, 2012:
As of/Year ended December 31, 2012
Domestic
Streaming
International
Streaming
Domestic
DVD Consolidated
(in thousands)
Total members at end of period (1) ....... 27,146 6,121 8,224 —
Revenues ........................... $2,184,868 $ 287,542 $1,136,872 $3,609,282
Cost of revenues ..................... 1,558,864 475,570 591,432 2,625,866
Marketing .......................... 256,995 201,115 7,290 465,400
Contribution profit (loss) .......... $ 369,009 $(389,143) $ 538,150 $ 518,016
Other operating expenses .............. 468,024
Operating income ................ 49,992
Other income (expense) ............... (19,512)
Provision for income taxes ............. 13,328
Net income ..................... $ 17,152
As of/Year ended December 31, 2012
Domestic
Streaming
International
Streaming
Domestic
DVD Consolidated
(in thousands)
Total content library, net ............... $2,317,070 $ 527,235 $ 29,865 $2,874,170
Amortization of content library .......... 1,152,446 438,772 65,396 1,656,614
70