NetFlix 2013 Annual Report Download - page 37
Download and view the complete annual report
Please find page 37 of the 2013 NetFlix annual report below. You can navigate through the pages in the report by either clicking on the pages listed below, or by using the keyword search tool below to find specific information within the annual report.-
 1
1 -
2
-
3
-
4
-
5
-
6
-
7
-
8
-
9
-
10
-
11
-
12
-
13
-
14
-
15
-
16
-
17
-
18
-
19
-
20
-
21
-
22
-
23
-
24
-
25
-
26
-
 27
27 -
 28
28 -
 29
29 -
 30
30 -
 31
31 -
 32
32 -
 33
33 -
 34
34 -
 35
35 -
 36
36 -
 37
37 -
 38
38 -
 39
39 -
 40
40 -
 41
41 -
 42
42 -
 43
43 -
 44
44 -
 45
45 -
 46
46 -
 47
47 -
48
-
49
-
50
-
51
-
52
-
53
-
54
-
55
-
56
-
57
-
58
-
59
-
60
-
61
-
62
-
63
-
64
-
65
-
66
-
67
-
68
-
69
-
70
-
71
-
72
-
73
-
74
-
75
-
76
-
77
-
78
 |
 |

Item 7A. Quantitative and Qualitative Disclosures about Market Risk
We are exposed to market risks related to interest rate changes, the corresponding changes in the market
values of our investments and foreign currency fluctuations.
Interest Rate Risk
The primary objective of our investment activities is to preserve principal, while at the same time
maximizing income we receive from investments without significantly increased risk. To achieve this objective,
we follow an established investment policy and set of guidelines to monitor and help mitigate our exposure to
interest rate and credit risk. The policy sets forth credit quality standards and limits our exposure to any one
issuer, as well as our maximum exposure to various asset classes. We maintain a portfolio of cash equivalents
and short-term investments in a variety of securities. These securities are classified as available-for-sale and are
recorded at fair value with unrealized gains and losses, net of tax, included in “Accumulated other
comprehensive income” within stockholders equity in the Consolidated Balance Sheets.
For the year ended December 31, 2013, we had no material impairment charges associated with our short-
term investment portfolio. Although we believe our current investment portfolio has very little risk of material
impairment, we cannot predict future market conditions or market liquidity and can provide no assurance that our
investment portfolio will remain materially unimpaired. Some of the securities we invest in may be subject to
market risk due to changes in prevailing interest rates which may cause the principal amount of the investment to
fluctuate. For example, if we hold a security that was issued with a fixed interest rate at the then-prevailing rate
and the prevailing interest rate later rises, the value of our investment will decline. At December 31, 2013, our
cash equivalents were generally invested in money market funds, which are not subject to market risk because
the interest paid on such funds fluctuates with the prevailing interest rate. Our short-term investments were
comprised of corporate debt securities, government and agency securities and asset and mortgage-backed
securities.
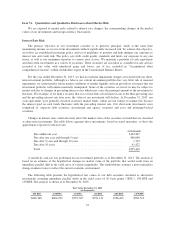
Changes in interest rates could adversely affect the market value of the securities we hold that are classified
as short-term investments. The table below separates these investments, based on stated maturities, to show the
approximate exposure to interest rates.
(in thousands)
Due within one year .............................................. $144,267
Due after one year and through 5 years ............................... 408,048
Due after 5 years and through 10 years ............................... 1,703
Due after 10 years ............................................... 41,422
Total .......................................................... $595,440
A sensitivity analysis was performed on our investment portfolio as of December 31, 2013. The analysis is
based on an estimate of the hypothetical changes in market value of the portfolio that would result from an
immediate parallel shift in the yield curve of various magnitudes. This methodology assumes a more immediate
change in interest rates to reflect the current economic environment.
The following table presents the hypothetical fair values of our debt securities classified as short-term
investments assuming immediate parallel shifts in the yield curve of 50 basis points (“BPS”), 100 BPS and
150 BPS. The analysis is shown as of December 31, 2013:
Fair Value December 31, 2013
(in thousands)
-150 BPS -100 BPS -50 BPS +50 BPS +100 BPS +150 BPS
$608,368 $604,059 $599,749 $591,131 $586,821 $582,512
35