NetFlix 2013 Annual Report Download - page 30
Download and view the complete annual report
Please find page 30 of the 2013 NetFlix annual report below. You can navigate through the pages in the report by either clicking on the pages listed below, or by using the keyword search tool below to find specific information within the annual report.-
 1
1 -
2
-
3
-
4
-
5
-
6
-
7
-
8
-
9
-
10
-
11
-
12
-
13
-
14
-
15
-
16
-
17
-
18
-
19
-
 20
20 -
 21
21 -
 22
22 -
 23
23 -
 24
24 -
 25
25 -
 26
26 -
 27
27 -
 28
28 -
 29
29 -
 30
30 -
 31
31 -
 32
32 -
 33
33 -
 34
34 -
 35
35 -
 36
36 -
 37
37 -
 38
38 -
 39
39 -
 40
40 -
41
-
42
-
43
-
44
-
45
-
46
-
47
-
48
-
49
-
50
-
51
-
52
-
53
-
54
-
55
-
56
-
57
-
58
-
59
-
60
-
61
-
62
-
63
-
64
-
65
-
66
-
67
-
68
-
69
-
70
-
71
-
72
-
73
-
74
-
75
-
76
-
77
-
78
 |
 |

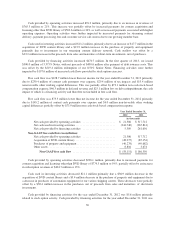
Provision for Income Taxes
Year Ended December 31, Change
2013 2012 2013 vs. 2012
(in thousands, except percentages)
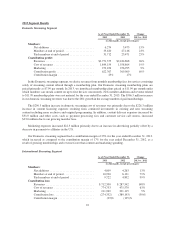
Provision for income taxes .......................... $58,671 $13,328 340%
Effective tax rate .................................. 34% 44%
In 2013, the difference between our effective tax rate and the federal statutory rate of 35% was $1.2 million
primarily due to the Federal and California research and development (“R&D”) credits partially offset by state
income taxes and nondeductible expenses. The decrease in our effective tax rate for the year ended December 31,
2013 as compared to the year ended December 31, 2012 was primarily attributable to the retroactive
reinstatement of the 2012 Federal R&D credit in January 2013.
On January 2, 2013, the American Taxpayer Relief Act of 2012 (H.R. 8) was signed into law which
retroactively extended the Federal R&D credit from January 1, 2012 through December 31, 2013. As a result, we
recognized the retroactive benefit of the 2012 Federal R&D credit of approximately $3.1 million as a discrete
item in the first quarter of 2013, the period in which the legislation was enacted.
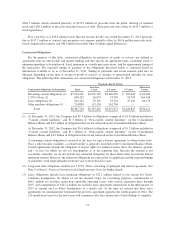
Year Ended December 31, Change
2012 2011 2012 vs. 2011
(in thousands, except percentages)
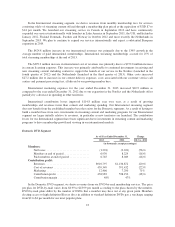
Provision for income taxes ......................... $13,328 $133,396 (90)%
Effective tax rate ................................. 44% 37%
In 2012, the difference between our effective tax rate and the federal statutory rate of 35% was $2.7 million
primarily due to state income taxes and nondeductible expenses partially offset by the California R&D credit.
The increase in our effective tax rate for the year ended December 31, 2012 as compared to the year ended
December 31, 2011 was primarily attributable to the expiration of the Federal R&D credit on December 31,
2011.
Liquidity and Capital Resources
Cash, cash equivalents and short-term investments were $1,200.4 million and $748.1 million at
December 31, 2013 and 2012, respectively. In February 2013, we issued $500.0 million aggregate principal
amount of 5.375% Senior Notes due 2021 (the “5.375% Notes”). We used approximately $224.5 million of the
net proceeds to redeem our outstanding 8.50% Notes, including a $19.4 million make-whole premium and
$5.1 million of accrued and unpaid interest. In November 2011, we issued $200.0 million of Senior Convertible
Notes and raised an additional $200.0 million through a public offering of common stock. The Senior
Convertible Notes consisted of $200.0 million aggregate principal amount due on December 1, 2018 and did not
bear interest. In April 2013, we exercised our option to cause the conversion of the Convertible Notes into shares
of our common stock. See Note 5 of Item 8, Financial Statements and Supplementary Data for additional
information.
Our primary uses of cash include licensing of content, content delivery, marketing programs and payroll.
We expect to continue to make significant investments to license streaming content both domestically and
internationally and will continue to expand our investments in original content. In 2014, we expect to
substantially increase our investment in original content (though still representing less than 10% of our overall
global content expense). Original content or content that is licensed in an earlier window through an output
arrangement will typically, depending upon the terms, require more up-front cash payments relative to the
expense and, therefore, future investments could impact our liquidity and result in a use of operating cash.
28