NetFlix 2013 Annual Report Download - page 67
Download and view the complete annual report
Please find page 67 of the 2013 NetFlix annual report below. You can navigate through the pages in the report by either clicking on the pages listed below, or by using the keyword search tool below to find specific information within the annual report.-
 1
1 -
2
-
3
-
4
-
5
-
6
-
7
-
8
-
9
-
10
-
11
-
12
-
13
-
14
-
15
-
16
-
17
-
18
-
19
-
20
-
21
-
22
-
23
-
24
-
25
-
26
-
27
-
28
-
29
-
30
-
31
-
32
-
33
-
34
-
35
-
36
-
37
-
38
-
39
-
40
-
41
-
42
-
43
-
44
-
45
-
46
-
47
-
48
-
49
-
50
-
51
-
52
-
53
-
54
-
55
-
56
-
 57
57 -
 58
58 -
 59
59 -
 60
60 -
 61
61 -
 62
62 -
 63
63 -
 64
64 -
 65
65 -
 66
66 -
 67
67 -
 68
68 -
 69
69 -
 70
70 -
 71
71 -
 72
72 -
 73
73 -
 74
74 -
 75
75 -
 76
76 -
 77
77 -
78
 |
 |

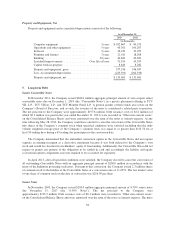
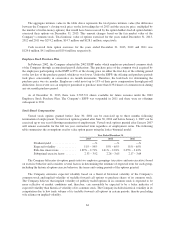
In valuing shares issued under the Company’s employee stock option plans, the Company bases the risk-free
interest rate on U.S. Treasury zero-coupon issues with terms similar to the contractual term of the options. The
Company does not anticipate paying any cash dividends in the foreseeable future and therefore uses an expected
dividend yield of zero in the option valuation model. The Company does not use a post-vesting termination rate
as options are fully vested upon grant date. The weighted-average fair value of employee stock options granted
during 2013, 2012 and 2011 was $113.74, $41.00 and $84.94 per share, respectively.
Stock-based compensation expense related to stock option plans was $73.1 million, $73.9 million and
$61.6 million for the years ended December 31, 2013, 2012 and 2011, respectively. The total income tax benefit
recognized in the income statement related to stock option plans was $28.1 million, $28.5 million and
$22.8 million for 2013, 2012 and 2011, respectively.
Stock Repurchase Program
The following table presents a summary of the Company’s stock repurchases for the year ended
December 31, 2011 (in thousands, except per share data):
Total number of shares repurchased .................................... 900
Dollar amount of shares repurchased ................................... $ 199,666
Average price paid per share .......................................... $ 221.88
Range of price paid per share ......................................... $160.11 – $248.78
Under the stock repurchase plan announced on June 11, 2010, the Company was authorized to repurchase up
to $300 million of its common stock through the end of 2012. As of December 31, 2012, the Company has
repurchased $259.0 million of its common stock under this plan. As of December 31, 2012, the plan has expired
and the remaining $41.0 million was unused.
9. Accumulated Other Comprehensive Income
The following table summarizes the changes in accumulated balances of other comprehensive income (loss),
net of tax:
Foreign
currency
Change in
unrealized gains
on available for
sale securities Total
(in thousands)
Balance as of December 31, 2011 ........................ $ 24 $ 682 $ 706
Other comprehensive income before reclassifications .... 1,357 1,275 2,632
Amounts reclassified from accumulated other
comprehensive income .......................... — (419) (419)
Net increase in other comprehensive income ....... 1,357 856 2,213
Balance as of December 31, 2012 ........................ $1,381 $ 1,538 $2,919
Other comprehensive income before reclassifications .... 1,772 (1,597) 175
Amounts reclassified from accumulated other
comprehensive income .......................... — 481 481
Net increase (decrease) in other comprehensive
income ................................... 1,772 (1,116) 656
Balance as of December 31, 2013 ........................ $3,153 $ 422 $3,575
65