NetFlix 2013 Annual Report Download - page 28
Download and view the complete annual report
Please find page 28 of the 2013 NetFlix annual report below. You can navigate through the pages in the report by either clicking on the pages listed below, or by using the keyword search tool below to find specific information within the annual report.-
 1
1 -
2
-
3
-
4
-
5
-
6
-
7
-
8
-
9
-
10
-
11
-
12
-
13
-
14
-
15
-
16
-
17
-
 18
18 -
 19
19 -
 20
20 -
 21
21 -
 22
22 -
 23
23 -
 24
24 -
 25
25 -
 26
26 -
 27
27 -
 28
28 -
 29
29 -
 30
30 -
 31
31 -
 32
32 -
 33
33 -
 34
34 -
 35
35 -
 36
36 -
 37
37 -
 38
38 -
39
-
40
-
41
-
42
-
43
-
44
-
45
-
46
-
47
-
48
-
49
-
50
-
51
-
52
-
53
-
54
-
55
-
56
-
57
-
58
-
59
-
60
-
61
-
62
-
63
-
64
-
65
-
66
-
67
-
68
-
69
-
70
-
71
-
72
-
73
-
74
-
75
-
76
-
77
-
78
 |
 |

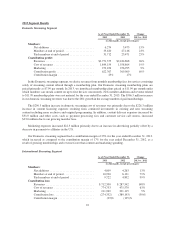
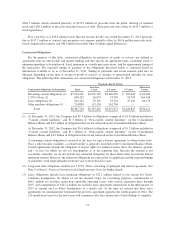
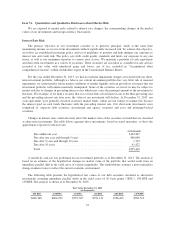
The $49.8 million increase in technology and development expenses was primarily the result of a
$42.8 million increase in personnel-related costs. These increases are primarily due to increases in employee
compensation as well as an 8% growth in average headcount supporting continued improvements in our
streaming service and international expansion.
Year Ended December 31, Change
2012 2011 2012 vs. 2011
(in thousands, except percentages)
Technology and development .......................... $329,008 $259,033 27%
As a percentage of revenues ........................... 9% 8%
The $70.0 million increase in technology and development expenses was primarily the result of a
$63.4 million increase in personnel-related costs, including a $12.7 million increase in stock-based
compensation. These increases are primarily due to a 35% growth in average headcount supporting continued
improvements in our streaming service and international expansion.
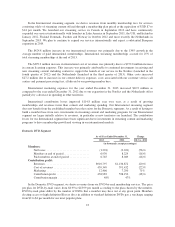
General and Administrative
General and administrative expenses consist of payroll and related expenses for corporate personnel, as well
as professional fees and other general corporate expenses. General and administrative expenses also include the
gain on disposal of DVDs.
Year Ended December 31, Change
2013 2012 2013 vs. 2012
(in thousands, except percentages)
General and administrative ........................ $180,301 $139,016 30%
As a percentage of revenues ....................... 4% 4%
General and administrative expenses increased $41.3 million primarily due to a $22.0 million increase in
personnel related costs resulting from a 31% increase in average headcount to support our growth. In addition,
expenses related to the use of outside and professional services, taxes and insurance increased $8.9 million. The
increase in expenses was further impacted by an $8.0 million decrease in the gain on the disposal of DVDs.
Year Ended December 31, Change
2012 2011 2012 vs. 2011
(in thousands, except percentages)
General and administrative ........................ $139,016 $148,306 (6)%
As a percentage of revenues ....................... 4% 5%
The $9.3 million decrease in general and administrative expenses was primarily attributable to a
$9.0 million expense in 2011 related to the settlement of a legal claim related to our compliance with the Video
Privacy Protection Act, a $5.8 million increase in the gain on sale of previously viewed DVDs, and an
$8.6 million decrease in miscellaneous expenses related to the use of outside and professional services, taxes,
insurance costs and to costs associated with various legal claims against us. These decreases were partially offset
by an increase in personnel-related costs of $14.1 million attributed to an 8% increase in average headcount.
26