NetFlix 2013 Annual Report Download - page 23
Download and view the complete annual report
Please find page 23 of the 2013 NetFlix annual report below. You can navigate through the pages in the report by either clicking on the pages listed below, or by using the keyword search tool below to find specific information within the annual report.-
 1
1 -
2
-
3
-
4
-
5
-
6
-
7
-
8
-
9
-
10
-
11
-
12
-
 13
13 -
 14
14 -
 15
15 -
 16
16 -
 17
17 -
 18
18 -
 19
19 -
 20
20 -
 21
21 -
 22
22 -
 23
23 -
 24
24 -
 25
25 -
 26
26 -
 27
27 -
 28
28 -
 29
29 -
 30
30 -
 31
31 -
 32
32 -
 33
33 -
34
-
35
-
36
-
37
-
38
-
39
-
40
-
41
-
42
-
43
-
44
-
45
-
46
-
47
-
48
-
49
-
50
-
51
-
52
-
53
-
54
-
55
-
56
-
57
-
58
-
59
-
60
-
61
-
62
-
63
-
64
-
65
-
66
-
67
-
68
-
69
-
70
-
71
-
72
-
73
-
74
-
75
-
76
-
77
-
78
 |
 |
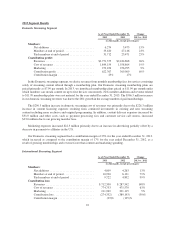
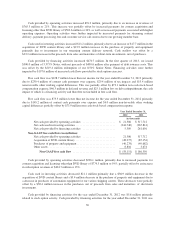
Free cash flow was $128.7 million lower than net income for the year ended December 31, 2013. The excess
of net income over free cash flow has increased from $75.3 million and $39.6 million in the years ended
December 31, 2012 and 2011, respectively. The increases are primarily the result of increased investments in
original content or content that is licensed in an earlier window through an output arrangement which will
typically, depending upon the terms, require more up-front cash payments relative to the expense.
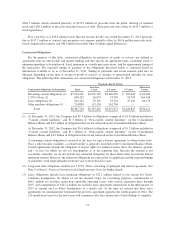
The following represents the key elements to our segment results of operations:
• We define contribution profit as revenues less cost of revenues and marketing expenses. We believe this
is an important measure of our operating segment performance as it represents each segment’s
performance before discrete global corporate costs.
• For the Domestic and International streaming segments, content licensing expenses, which include the
amortization of the streaming content library and other expenses associated with the licensing of
streaming content, represent the vast majority of cost of revenues. Streaming content rights are generally
specific to a geographic region and accordingly our international expansion will require us to obtain
additional streaming content licenses to support new international markets. Other cost of revenues such
as content delivery expenses, customer service and payment processing fees are lower as a percentage of
total cost of revenues as compared to content licensing expenses. We utilize both our own and third-party
content delivery networks to help us efficiently stream a high volume of content to our members over the
Internet. Content delivery expenses, therefore, also include equipment costs related to our streaming
content delivery network (“Open Connect”) and all third-party costs associated with delivering streaming
content over the Internet. Cost of revenues in the Domestic DVD segment consists primarily of content
delivery, expenses related to the acquisition of content, including amortization of DVD content library
and revenue sharing expenses, and other expenses associated with our DVD processing and customer
service centers. Content delivery expenses for the Domestic DVD segment consist of the postage costs to
mail DVDs to and from our paying members and the packaging and label costs for the mailers.
• For the Domestic and International streaming segments, marketing expenses consist primarily of
advertising expenses and payments made to our affiliates and consumer electronics partners. Advertising
expenses include promotional activities such as television and online advertising. Payments to our
affiliates and device partners include fixed fee and /or revenue sharing payments. Marketing costs are
primarily incurred by our Domestic and International streaming segments given our focus on building
consumer awareness of the streaming offerings. Marketing expenses incurred by our International
streaming segment have been significant and will fluctuate dependent upon the number of International
territories in which our streaming service is offered and the timing of the launch of new territories.
Marketing costs are immaterial for the Domestic DVD segment.
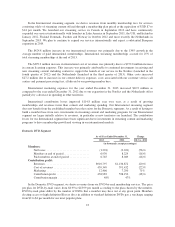
• We have demonstrated our ability to grow contribution margin as evidenced by the increase in
contribution margin from 12% when we first began separately reporting Domestic streaming results in
the fourth quarter of 2011 to 23% in the fourth quarter of 2013. As a result of our focus on growing the
streaming segments, contribution margins for the Domestic and International streaming segments are
lower than for our Domestic DVD segment. Investments in content and marketing associated with the
International streaming segment will continue to fluctuate dependent upon the number of International
territories in which our streaming service is offered and the timing of the launch of new territories.
• As we grow our streaming segments, we continue to shift spending away from the Domestic DVD
segment to invest more in streaming content and marketing for our streaming services.
21