NetFlix 2013 Annual Report Download - page 32
Download and view the complete annual report
Please find page 32 of the 2013 NetFlix annual report below. You can navigate through the pages in the report by either clicking on the pages listed below, or by using the keyword search tool below to find specific information within the annual report.-
 1
1 -
2
-
3
-
4
-
5
-
6
-
7
-
8
-
9
-
10
-
11
-
12
-
13
-
14
-
15
-
16
-
17
-
18
-
19
-
20
-
21
-
 22
22 -
 23
23 -
 24
24 -
 25
25 -
 26
26 -
 27
27 -
 28
28 -
 29
29 -
 30
30 -
 31
31 -
 32
32 -
 33
33 -
 34
34 -
 35
35 -
 36
36 -
 37
37 -
 38
38 -
 39
39 -
 40
40 -
 41
41 -
 42
42 -
43
-
44
-
45
-
46
-
47
-
48
-
49
-
50
-
51
-
52
-
53
-
54
-
55
-
56
-
57
-
58
-
59
-
60
-
61
-
62
-
63
-
64
-
65
-
66
-
67
-
68
-
69
-
70
-
71
-
72
-
73
-
74
-
75
-
76
-
77
-
78
 |
 |

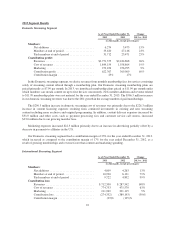
Cash provided by operating activities increased $76.2 million, primarily due to an increase in revenues of
$765.3 million or 21%. This increase was partially offset by increased payments for content acquisition and
licensing other than DVD library of $502.6 million or 24% as well as increased payments associated with higher
operating expenses. Operating activities were further impacted by increased payments for streaming content
delivery, payment processing fees and customer service call centers due to our growing member base.
Cash used in investing activities increased $11.2 million, primarily due to an increase of $17.7 million in the
acquisition of DVD content library and a $13.9 million increase in the purchase of property and equipment
primarily due to investments in our streaming content delivery network. Cash outflow was offset by a
$23.2 million increase in the proceeds from sales and maturities of short-term investments, net of purchases.
Cash provided by financing activities increased $470.7 million. In the first quarter of 2013, we issued
$500.0 million of 5.375% Notes, with net proceeds of $490.6 million after payment of debt issuance costs. This
was offset by the $219.4 million redemption of our 8.50% Senior Notes. Financing activities were further
impacted by $197.6 million of increased cash flows provided by stock option exercises.
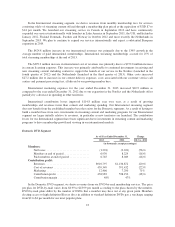
Free cash flow was $128.7 million lower than net income for the year ended December 31, 2013 primarily
due to $230.4 million of content cash payments over expense, $29.4 million of tax impacts and $13.4 million
non-favorable other working capital differences. This was partially offset by $73.1 million non-cash stock-based
compensation expense, $46.3 million in deferred revenue and $25.1 million loss on debt extinguishment, the cash
impact of which is a financing activity and therefore not included in free cash flow.
Free cash flow was $75.3 million lower than net income for the year ended December 31, 2012 primarily
due to $145.2 million of content cash payments over expense and $4.0 million non-favorable other working
capital differences partially offset by $73.9 million non-cash stock-based compensation expense.
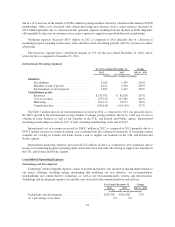
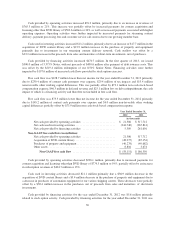
Year Ended December 31,
2012 2011
(in thousands)
Net cash provided by operating activities ....................... $ 21,586 $ 317,712
Net cash used in investing activities ............................ (244,740) (265,814)
Net cash provided by financing activities ....................... 5,589 261,656
Non-GAAP free cash flow reconciliation:
Net cash provided by operating activities ....................... 21,586 317,712
Acquisition of DVD content library ............................ (48,275) (85,154)
Purchases of property and equipment ........................... (40,278) (49,682)
Other assets ............................................... 8,816 3,674
Non-GAAP free cash flow .............................. $ (58,151) $ 186,550
Cash provided by operating activities decreased $296.1 million, primarily due to increased payments for
content acquisition and licensing other than DVD library of $779.5 million or 59%, partially offset by an increase
in subscription revenues of $404.7 million or 13%.
Cash used in investing activities decreased $21.1 million primarily due a $36.9 million decrease in the
acquisition of DVD content library and a $9.4 million decrease in the purchase of property and equipment due to
a decrease in purchases of automation equipment for our various shipping centers. These decreases were partially
offset by a $30.4 million increase in the purchases, net of proceeds from sales and maturities, of short-term
investments.
Cash provided by financing activities for the year ended December 31, 2012 was $5.6 million primarily
related to stock option activity. Cash provided by financing activities for the year ended December 31, 2011 was
30