NetFlix 2013 Annual Report Download - page 31
Download and view the complete annual report
Please find page 31 of the 2013 NetFlix annual report below. You can navigate through the pages in the report by either clicking on the pages listed below, or by using the keyword search tool below to find specific information within the annual report.-
 1
1 -
2
-
3
-
4
-
5
-
6
-
7
-
8
-
9
-
10
-
11
-
12
-
13
-
14
-
15
-
16
-
17
-
18
-
19
-
20
-
 21
21 -
 22
22 -
 23
23 -
 24
24 -
 25
25 -
 26
26 -
 27
27 -
 28
28 -
 29
29 -
 30
30 -
 31
31 -
 32
32 -
 33
33 -
 34
34 -
 35
35 -
 36
36 -
 37
37 -
 38
38 -
 39
39 -
 40
40 -
 41
41 -
42
-
43
-
44
-
45
-
46
-
47
-
48
-
49
-
50
-
51
-
52
-
53
-
54
-
55
-
56
-
57
-
58
-
59
-
60
-
61
-
62
-
63
-
64
-
65
-
66
-
67
-
68
-
69
-
70
-
71
-
72
-
73
-
74
-
75
-
76
-
77
-
78
 |
 |

We expect to significantly increase our investments in international expansion, including substantial
expansion in Europe in 2014, and in original content. As a result, and to take advantage of the current favorable
interest rate environment, we plan to obtain approximately $400 million in long term debt in the first quarter of
2014. Our ability to obtain this, or any additional financing that we may choose to or need to obtain, will depend
on, among other things, our development efforts, business plans, operating performance and the condition of the
capital markets at the time we seek financing. We may not be able to obtain such financing on terms acceptable
to us or at all. If we raise additional funds through the issuance of equity or debt securities, those securities may
have rights, preferences or privileges senior to the rights of our common stock, and our stockholders may
experience dilution.
As of December 31, 2013, $55.8 million of cash and cash equivalents were held by our foreign subsidiaries.
If these funds are needed for our operations in the U.S., we would be required to accrue and pay U.S. income
taxes and foreign withholding taxes on the amount associated with undistributed earnings for certain foreign
subsidiaries. See Note 10 of Item 8, Financial Statements and Supplementary Data for additional information.
On June 11, 2010, we announced that our Board of Directors authorized a stock repurchase program
allowing us to repurchase $300.0 million of our common stock through the end of 2012. Under this plan, we
repurchased $259.0 million. At December 31, 2012, this authorization expired and the remaining $41.0 million
was not used.
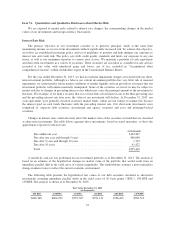
Free Cash Flow
We define free cash flow as cash provided by operating and investing activities excluding the non-
operational cash flows from purchases, maturities and sales of short-term investments. We believe free cash flow
is an important liquidity metric because it measures, during a given period, the amount of cash generated that is
available to repay debt obligations, make investments and for certain other activities. Free cash flow is
considered a non-GAAP financial measure and should not be considered in isolation of, or as a substitute for, net
income, operating income, cash flow provided by operating activities, or any other measure of financial
performance or liquidity presented in accordance with GAAP.
In assessing liquidity in relation to our results of operations, we compare free cash flow to net income,
noting that the three major recurring differences are excess content payments over expenses, non-cash stock-
based compensation expense and other working capital differences which include deferred revenue, taxes and
semi-annual interest payments on outstanding debt. Our receivables from members settle quickly and deferred
revenue is a source of cash flow. For streaming content, we typically enter into multi-year licenses with various
content providers that may result in an increase in content library and a corresponding increase in liabilities on
the Consolidated Balance Sheets. The payment terms for these license fees may extend over the term of the
license agreements, which typically range from six months to five years.
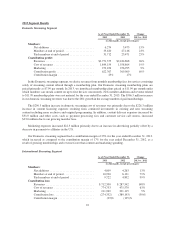
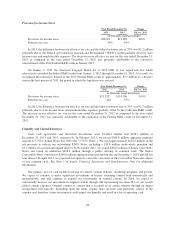
Year Ended December 31,
2013 2012
(in thousands)
Net cash provided by operating activities ....................... $ 97,831 $ 21,586
Net cash used in investing activities ............................ (255,968) (244,740)
Net cash provided by financing activities ....................... 476,264 5,589
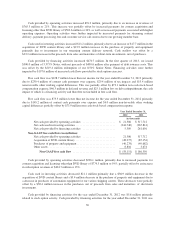
Non-GAAP free cash flow reconciliation:
Net cash provided by operating activities ....................... 97,831 21,586
Acquisition of DVD content library ............................ (65,927) (48,275)
Purchases of property and equipment ........................... (54,143) (40,278)
Other assets ............................................... 5,939 8,816
Non-GAAP free cash flow .............................. $ (16,300) $ (58,151)
29