NetFlix 2013 Annual Report Download - page 24
Download and view the complete annual report
Please find page 24 of the 2013 NetFlix annual report below. You can navigate through the pages in the report by either clicking on the pages listed below, or by using the keyword search tool below to find specific information within the annual report.-
 1
1 -
2
-
3
-
4
-
5
-
6
-
7
-
8
-
9
-
10
-
11
-
12
-
13
-
 14
14 -
 15
15 -
 16
16 -
 17
17 -
 18
18 -
 19
19 -
 20
20 -
 21
21 -
 22
22 -
 23
23 -
 24
24 -
 25
25 -
 26
26 -
 27
27 -
 28
28 -
 29
29 -
 30
30 -
 31
31 -
 32
32 -
 33
33 -
 34
34 -
35
-
36
-
37
-
38
-
39
-
40
-
41
-
42
-
43
-
44
-
45
-
46
-
47
-
48
-
49
-
50
-
51
-
52
-
53
-
54
-
55
-
56
-
57
-
58
-
59
-
60
-
61
-
62
-
63
-
64
-
65
-
66
-
67
-
68
-
69
-
70
-
71
-
72
-
73
-
74
-
75
-
76
-
77
-
78
 |
 |

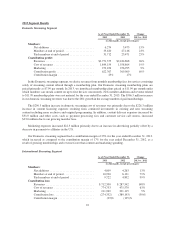
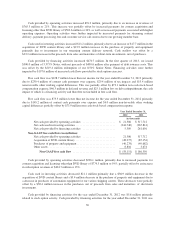
2013 Segment Results
Domestic Streaming Segment
As of /Year Ended December 31, Change
2013 2012 2013 vs. 2012
(in thousands, except percentages)
Members:
Net additions ............................... 6,274 5,475 15%
Members at end of period ..................... 33,420 27,146 23%
Paid members at end of period ................. 31,712 25,471 25%
Contribution profit:
Revenues .................................. $2,751,375 $2,184,868 26%
Cost of revenues ............................ 1,849,154 1,558,864 19%
Marketing ................................. 279,454 256,995 9%
Contribution profit .......................... 622,767 369,009 69%
Contribution margin ......................... 23% 17%
In the Domestic streaming segment, we derive revenues from monthly membership fees for services consisting
solely of streaming content offered through a membership plan. Our Domestic streaming membership plans are
priced primarily at $7.99 per month. In 2013, we introduced membership plans priced at $11.99 per month under
which members can stream content on up to four devices concurrently. New member additions and revenue related
to $11.99 membership plans were not material for the year ended December 31, 2013. The $566.5 million increase
in our domestic streaming revenues was due to the 26% growth in the average number of paid memberships.
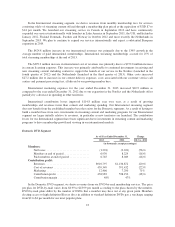
The $290.3 million increase in domestic streaming cost of revenues was primarily due to the $226.3 million
increase in content licensing expenses resulting from continued investments in existing and new streaming
content including more exclusive and original programming. In addition, content delivery expenses increased by
$31.0 million and other costs, such as payment processing fees and customer service call centers, increased
$33.0 million due to our growing member base.
Marketing expenses increased $22.5 million primarily due to an increase in advertising partially offset by a
decrease in payments to affiliates in the U.S.
Our Domestic streaming segment had a contribution margin of 23% for the year ended December 31, 2013,
which increased as compared to the contribution margin of 17% for the year ended December 31, 2012, as a
result of growing memberships and revenue faster than content and marketing spending.
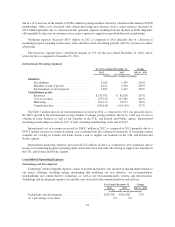
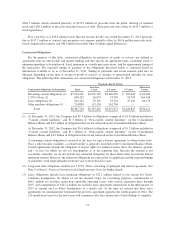
International Streaming Segment
As of /Year Ended December 31, Change
2013 2012 2013 vs. 2012
(in thousands, except percentages)
Members:
Net additions ............................... 4,809 4,263 13%
Members at end of period ..................... 10,930 6,121 79%
Paid members at end of period ................. 9,722 4,892 99%
Contribution loss:
Revenues .................................. $712,390 $ 287,542 148%
Cost of revenues ............................ 774,753 475,570 63%
Marketing ................................. 211,969 201,115 5%
Contribution loss ............................ (274,332) (389,143) (30)%
Contribution margin ......................... (39)% (135)%
22