NetFlix 2013 Annual Report Download - page 51
Download and view the complete annual report
Please find page 51 of the 2013 NetFlix annual report below. You can navigate through the pages in the report by either clicking on the pages listed below, or by using the keyword search tool below to find specific information within the annual report.-
 1
1 -
2
-
3
-
4
-
5
-
6
-
7
-
8
-
9
-
10
-
11
-
12
-
13
-
14
-
15
-
16
-
17
-
18
-
19
-
20
-
21
-
22
-
23
-
24
-
25
-
26
-
27
-
28
-
29
-
30
-
31
-
32
-
33
-
34
-
35
-
36
-
37
-
38
-
39
-
40
-
 41
41 -
 42
42 -
 43
43 -
 44
44 -
 45
45 -
 46
46 -
 47
47 -
 48
48 -
 49
49 -
 50
50 -
 51
51 -
 52
52 -
 53
53 -
 54
54 -
 55
55 -
 56
56 -
 57
57 -
 58
58 -
 59
59 -
 60
60 -
 61
61 -
62
-
63
-
64
-
65
-
66
-
67
-
68
-
69
-
70
-
71
-
72
-
73
-
74
-
75
-
76
-
77
-
78
 |
 |

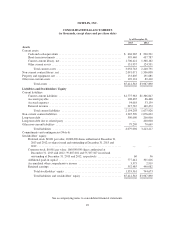
NETFLIX, INC.
CONSOLIDATED BALANCE SHEETS
(in thousands, except share and per share data)
As of December 31,
2013 2012
Assets
Current assets:
Cash and cash equivalents ............................................ $ 604,965 $ 290,291
Short-term investments .............................................. 595,440 457,787
Current content library, net ........................................... 1,706,421 1,368,162
Other current assets ................................................. 151,937 124,551
Total current assets ............................................. 3,058,763 2,240,791
Non-current content library, net ........................................... 2,091,071 1,506,008
Property and equipment, net .............................................. 133,605 131,681
Other non-current assets ................................................. 129,124 89,410
Total assets ................................................... $5,412,563 $3,967,890
Liabilities and Stockholders’ Equity
Current liabilities:
Current content liabilities ............................................ $1,775,983 $1,366,847
Accounts payable .................................................. 108,435 86,468
Accrued expenses .................................................. 54,018 53,139
Deferred revenue ................................................... 215,767 169,472
Total current liabilities .......................................... 2,154,203 1,675,926
Non-current content liabilities ............................................. 1,345,590 1,076,622
Long-term debt ........................................................ 500,000 200,000
Long-term debt due to related party ........................................ — 200,000
Other non-current liabilities .............................................. 79,209 70,669
Total liabilities ................................................ 4,079,002 3,223,217
Commitments and contingencies (Note 6)
Stockholders’ equity:
Preferred stock, $0.001 par value; 10,000,000 shares authorized at December 31,
2013 and 2012; no shares issued and outstanding at December 31, 2013 and
2012 ........................................................... — —
Common stock, $0.001 par value; 160,000,000 shares authorized at
December 31, 2013 and 2012; 59,607,001 and 55,587,167 issued and
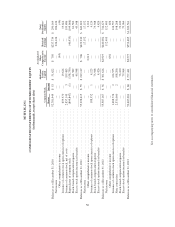
outstanding at December 31, 2013 and 2012, respectively ................. 60 56
Additional paid-in capital ............................................ 777,441 301,616
Accumulated other comprehensive income .............................. 3,575 2,919
Retained earnings .................................................. 552,485 440,082
Total stockholders’ equity ........................................ 1,333,561 744,673
Total liabilities and stockholders’ equity ............................ $5,412,563 $3,967,890
See accompanying notes to consolidated financial statements.
49