NetFlix 2013 Annual Report Download - page 22
Download and view the complete annual report
Please find page 22 of the 2013 NetFlix annual report below. You can navigate through the pages in the report by either clicking on the pages listed below, or by using the keyword search tool below to find specific information within the annual report.-
 1
1 -
2
-
3
-
4
-
5
-
6
-
7
-
8
-
9
-
10
-
11
-
 12
12 -
 13
13 -
 14
14 -
 15
15 -
 16
16 -
 17
17 -
 18
18 -
 19
19 -
 20
20 -
 21
21 -
 22
22 -
 23
23 -
 24
24 -
 25
25 -
 26
26 -
 27
27 -
 28
28 -
 29
29 -
 30
30 -
 31
31 -
 32
32 -
33
-
34
-
35
-
36
-
37
-
38
-
39
-
40
-
41
-
42
-
43
-
44
-
45
-
46
-
47
-
48
-
49
-
50
-
51
-
52
-
53
-
54
-
55
-
56
-
57
-
58
-
59
-
60
-
61
-
62
-
63
-
64
-
65
-
66
-
67
-
68
-
69
-
70
-
71
-
72
-
73
-
74
-
75
-
76
-
77
-
78
 |
 |

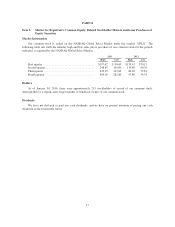
Other Data:
As of / Year Ended December 31,
2013 2012 2011 2010 2009
(in thousands)
Net consolidated streaming member additions during
period ...................................... 11,083 9,738 — — —
Total consolidated streaming members .............. 44,350 33,267 23,529 — —
Prior to certain changes to our pricing and plan structure in 2011, we did not separately track streaming
memberships.
Item 7. Management’s Discussion and Analysis of Financial Condition and Results of Operations
Overview
We are the world’s leading Internet television network with more than 44 million streaming members in
over 40 countries enjoying more than one billion hours of TV shows and movies per month, including original
series. Our members can watch as much as they want, anytime, anywhere, on nearly any Internet-connected
screen. Members can play, pause and resume watching, all without commercials or commitments. Additionally,
in the United States (“U.S.”), our members can receive DVDs delivered quickly to their homes.
We are a pioneer in the Internet delivery of TV shows and movies, launching our streaming service in 2007.
Since this launch, we have developed an ecosystem for Internet-connected devices and have licensed increasing
amounts of content that enable consumers to enjoy TV shows and movies directly on their TVs, computers and
mobile devices. As a result of these efforts, we have experienced growing consumer acceptance of and interest in
the delivery of TV shows and movies directly over the Internet. Historically, our acquisition of new members has
been seasonal with the first and fourth quarters representing our strongest net member additions and our second
quarter representing the lowest net member additions in a calendar year.
Our core strategy is to grow our streaming subscription business domestically and internationally. We are
continuously improving our members’ experience—expanding our streaming content, with a focus on
programming an overall mix of content that delights our customers, enhancing our user interface and extending
our streaming service to even more Internet-connected devices while staying within the parameters of our
consolidated net income (loss) and operating segment contribution profit (loss) targets.
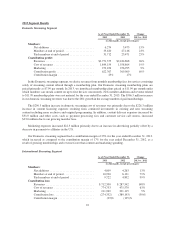
Results of Operations
The following represents our consolidated performance highlights:
Year Ended December 31, Change
2013 2012 2011 2013 vs. 2012 2012 vs. 2011
(in thousands)
Revenues ............................ $4,374,562 $3,609,282 $3,204,577 21% 13%
Operating income ..................... 228,347 49,992 376,068 357% (87)%
Net income .......................... 112,403 17,152 226,126 555% (92)%
Free cash flow (1) ..................... (16,300) (58,151) 186,550 72% NM
(1) See “Liquidity and Capital Resources” for a definition of “free cash flow” and a reconciliation of “free cash
flow” to “net cash provided by operating activities.”
Consolidated revenues for 2013 increased as compared to prior years due to growth in international and
domestic streaming memberships. Operating income and net income increased as compared to prior year by
$178.4 million and $95.3 million, respectively, due to the increase in revenue, partially offset by an increase in
the cost of revenues due to continued investments in existing and new streaming content.
20