NetFlix 2013 Annual Report Download - page 27
Download and view the complete annual report
Please find page 27 of the 2013 NetFlix annual report below. You can navigate through the pages in the report by either clicking on the pages listed below, or by using the keyword search tool below to find specific information within the annual report.-
 1
1 -
2
-
3
-
4
-
5
-
6
-
7
-
8
-
9
-
10
-
11
-
12
-
13
-
14
-
15
-
16
-
 17
17 -
 18
18 -
 19
19 -
 20
20 -
 21
21 -
 22
22 -
 23
23 -
 24
24 -
 25
25 -
 26
26 -
 27
27 -
 28
28 -
 29
29 -
 30
30 -
 31
31 -
 32
32 -
 33
33 -
 34
34 -
 35
35 -
 36
36 -
 37
37 -
38
-
39
-
40
-
41
-
42
-
43
-
44
-
45
-
46
-
47
-
48
-
49
-
50
-
51
-
52
-
53
-
54
-
55
-
56
-
57
-
58
-
59
-
60
-
61
-
62
-
63
-
64
-
65
-
66
-
67
-
68
-
69
-
70
-
71
-
72
-
73
-
74
-
75
-
76
-
77
-
78
 |
 |

due to a 41% decrease in the number of DVDs mailed to paying members driven by a decline in the number of DVD
memberships. Other costs associated with content processing and customer service center expenses decreased by
$13.9 million primarily due to a decrease in hub operation expenses resulting from the declines in DVD shipments,
offset partially by increases in customer service center expenses to support our growth in domestic memberships.
Marketing expenses decreased $38.5 million in 2012 as compared to 2011 primarily due to a decrease in
marketing program spending in television, radio and direct mail advertising partially offset by increases in online
advertising.
The Domestic segment had a contribution margin of 27% for the year ended December 31, 2012, and is
relatively flat as compared to December 31, 2011.
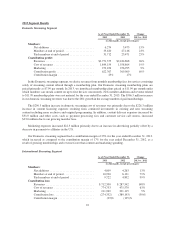
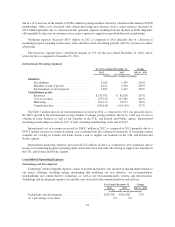
International Streaming Segment
As of /Year Ended December 31, Change
2012 2011 2012 vs. 2011
(in thousands, except percentages)
Members:
Net additions ............................ 4,263 1,349 216%
Members at end of period .................. 6,121 1,858 229%
Paid members at end of period .............. 4,892 1,447 238%
Contribution profit:
Revenues ............................... $287,542 $ 82,850 247%
Cost of revenues ......................... 475,570 107,482 342%
Marketing .............................. 201,115 78,517 156%
Contribution loss ........................ (389,143) (103,149) 277%
The $204.7 million increase in our international revenues in 2012 as compared to 2011 was primarily due to
the 260% growth in the international average number of unique paying members driven by a full year of service
offering in Latin America as well as our launches in the U.K. and Ireland and Nordic regions. International
streaming memberships account for 18% of total streaming memberships at the end of 2012.
International cost of revenues increased by $368.1 million in 2012 as compared to 2011 primarily due to a
$347.5 million increase in content licensing costs resulting from the continued investments in streaming content
available for viewing in Canada and Latin America and to support our launches in the U.K. and Ireland and
Nordic regions.
International marketing expenses increased $122.6 million in 2012 as compared to 2011 primarily due to
increases in marketing program spending online and in television and radio advertising to support our launches in
the U.K. and Ireland and Nordic regions.
Consolidated Operating Expenses
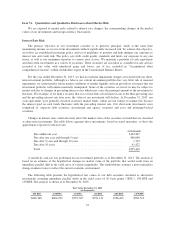
Technology and Development
Technology and development expenses consist of payroll and related costs incurred in making improvements to
our service offerings, including testing, maintaining and modifying our user interface, our recommendation,
merchandising and content delivery technology, as well as our telecommunications systems and infrastructures.
Technology and development expenses also include costs associated with computer hardware and software.
Year Ended December 31, Change
2013 2012 2013 vs. 2012
(in thousands, except percentages)
Technology and development .......................... $378,769 $329,008 15%
As a percentage of revenues ........................... 9% 9%
25