NetFlix 2013 Annual Report Download - page 50
Download and view the complete annual report
Please find page 50 of the 2013 NetFlix annual report below. You can navigate through the pages in the report by either clicking on the pages listed below, or by using the keyword search tool below to find specific information within the annual report.-
 1
1 -
2
-
3
-
4
-
5
-
6
-
7
-
8
-
9
-
10
-
11
-
12
-
13
-
14
-
15
-
16
-
17
-
18
-
19
-
20
-
21
-
22
-
23
-
24
-
25
-
26
-
27
-
28
-
29
-
30
-
31
-
32
-
33
-
34
-
35
-
36
-
37
-
38
-
39
-
 40
40 -
 41
41 -
 42
42 -
 43
43 -
 44
44 -
 45
45 -
 46
46 -
 47
47 -
 48
48 -
 49
49 -
 50
50 -
 51
51 -
 52
52 -
 53
53 -
 54
54 -
 55
55 -
 56
56 -
 57
57 -
 58
58 -
 59
59 -
 60
60 -
61
-
62
-
63
-
64
-
65
-
66
-
67
-
68
-
69
-
70
-
71
-
72
-
73
-
74
-
75
-
76
-
77
-
78
 |
 |

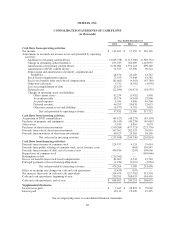
NETFLIX, INC.
CONSOLIDATED STATEMENTS OF CASH FLOWS
(in thousands)
Year Ended December 31,
2013 2012 2011
Cash flows from operating activities:
Net income .................................................. $ 112,403 $ 17,152 $ 226,126
Adjustments to reconcile net income to net cash provided by operating
activities:
Additions to streaming content library ......................... (3,049,758) (2,515,506) (2,320,732)
Change in streaming content liabilities ......................... 673,785 762,089 1,463,955
Amortization of streaming content library ...................... 2,121,981 1,591,218 699,128
Amortization of DVD content library .......................... 71,325 65,396 96,744
Depreciation and amortization of property, equipment and
intangibles ............................................. 48,374 45,469 43,747
Stock-based compensation expense ........................... 73,100 73,948 61,582
Excess tax benefits from stock-based compensation .............. (81,663) (4,543) (45,784)
Other non-cash items ...................................... 5,332 (8,392) (4,050)
Loss on extinguishment of debt .............................. 25,129 — —
Deferred taxes (22,044) (30,071) (18,597)
Changes in operating assets and liabilities:
Other current assets .................................... 62,234 (5,432) 1,436
Accounts payable ..................................... 18,374 (4,943) 23,968
Accrued expenses ..................................... 1,941 9,806 65,560
Deferred revenue ...................................... 46,295 20,676 21,613
Other non-current assets and liabilities ..................... (8,977) 4,719 3,016
Net cash provided by operating activities ............... 97,831 21,586 317,712
Cash flows from investing activities:
Acquisition of DVD content library ............................... (65,927) (48,275) (85,154)
Purchases of property and equipment .............................. (54,143) (40,278) (49,682)
Other assets .................................................. 5,939 8,816 3,674
Purchases of short-term investments .............................. (550,264) (477,321) (223,750)
Proceeds from sale of short-term investments ....................... 347,502 282,953 50,993
Proceeds from maturities of short-term investments .................. 60,925 29,365 38,105
Net cash used in investing activities ................... (255,968) (244,740) (265,814)
Cash flows from financing activities:
Proceeds from issuance of common stock .......................... 124,557 4,124 19,614
Proceeds from public offering of common stock, net of issuance costs .... — (464) 199,947
Proceeds from issuance of debt, net of issuance costs ................. 490,586 (295) 198,060
Repurchases of common stock ................................... — — (199,666)
Redemption of debt ............................................ (219,362) — —
Excess tax benefits from stock-based compensation .................. 81,663 4,543 45,784
Principal payments of lease financing obligations .................... (1,180) (2,319) (2,083)
Net cash provided by financing activities ............... 476,264 5,589 261,656
Effect of exchange rate changes on cash and cash equivalents .......... (3,453) (197) —
Net increase (decrease) in cash and cash equivalents .................. 314,674 (217,762) 313,554
Cash and cash equivalents, beginning of year ....................... 290,291 508,053 194,499
Cash and cash equivalents, end of year ............................ $ 604,965 $ 290,291 $ 508,053
Supplemental disclosure:
Income taxes paid ............................................. $ 7,465 $ 28,853 $ 79,069
Interest paid .................................................. 19,114 19,009 19,395
See accompanying notes to consolidated financial statements.
48