NetFlix 2013 Annual Report Download - page 48
Download and view the complete annual report
Please find page 48 of the 2013 NetFlix annual report below. You can navigate through the pages in the report by either clicking on the pages listed below, or by using the keyword search tool below to find specific information within the annual report.-
 1
1 -
2
-
3
-
4
-
5
-
6
-
7
-
8
-
9
-
10
-
11
-
12
-
13
-
14
-
15
-
16
-
17
-
18
-
19
-
20
-
21
-
22
-
23
-
24
-
25
-
26
-
27
-
28
-
29
-
30
-
31
-
32
-
33
-
34
-
35
-
36
-
37
-
 38
38 -
 39
39 -
 40
40 -
 41
41 -
 42
42 -
 43
43 -
 44
44 -
 45
45 -
 46
46 -
 47
47 -
 48
48 -
 49
49 -
 50
50 -
 51
51 -
 52
52 -
 53
53 -
 54
54 -
 55
55 -
 56
56 -
 57
57 -
 58
58 -
59
-
60
-
61
-
62
-
63
-
64
-
65
-
66
-
67
-
68
-
69
-
70
-
71
-
72
-
73
-
74
-
75
-
76
-
77
-
78
 |
 |

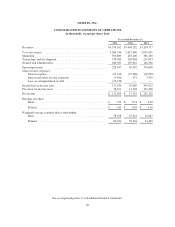
NETFLIX, INC.
CONSOLIDATED STATEMENTS OF OPERATIONS
(in thousands, except per share data)
Year ended December 31,
2013 2012 2011
Revenues .................................................. $4,374,562 $3,609,282 $3,204,577
Cost of revenues ............................................ 3,083,256 2,625,866 2,039,901
Marketing ................................................. 503,889 465,400 381,269
Technology and development .................................. 378,769 329,008 259,033
General and administrative .................................... 180,301 139,016 148,306
Operating income ........................................... 228,347 49,992 376,068
Other income (expense):
Interest expense ......................................... (29,142) (19,986) (20,025)
Interest and other income (expense) ......................... (3,002) 474 3,479
Loss on extinguishment of debt ............................ (25,129) — —
Income before income taxes ................................... 171,074 30,480 359,522
Provision for income taxes .................................... 58,671 13,328 133,396
Net income ................................................ $ 112,403 $ 17,152 $ 226,126
Earnings per share:
Basic ................................................. $ 1.93 $ 0.31 $ 4.28
Diluted ................................................ $ 1.85 $ 0.29 $ 4.16
Weighted-average common shares outstanding:
Basic ................................................. 58,198 55,521 52,847
Diluted ................................................ 60,761 58,904 54,369
See accompanying notes to consolidated financial statements.
46