MasterCard 2014 Annual Report Download - page 77
Download and view the complete annual report
Please find page 77 of the 2014 MasterCard annual report below. You can navigate through the pages in the report by either clicking on the pages listed below, or by using the keyword search tool below to find specific information within the annual report.-
 1
1 -
2
-
3
-
4
-
5
-
6
-
7
-
8
-
9
-
10
-
11
-
12
-
13
-
14
-
15
-
16
-
17
-
18
-
19
-
20
-
21
-
22
-
23
-
24
-
25
-
26
-
27
-
28
-
29
-
30
-
31
-
32
-
33
-
34
-
35
-
36
-
37
-
38
-
39
-
40
-
41
-
42
-
43
-
44
-
45
-
46
-
47
-
48
-
49
-
50
-
51
-
52
-
53
-
54
-
55
-
56
-
57
-
58
-
59
-
60
-
61
-
62
-
63
-
64
-
65
-
66
-
 67
67 -
 68
68 -
 69
69 -
 70
70 -
 71
71 -
 72
72 -
 73
73 -
 74
74 -
 75
75 -
 76
76 -
 77
77 -
 78
78 -
 79
79 -
 80
80 -
 81
81 -
 82
82 -
 83
83 -
 84
84 -
 85
85 -
 86
86 -
 87
87 -
88
-
89
-
90
-
91
-
92
-
93
-
94
-
95
-
96
-
97
-
98
-
99
-
100
-
101
-
102
 |
 |

MASTERCARD INCORPORATED
NOTES TO CONSOLIDATED FINANCIAL STATEMENTS – (Continued)
75
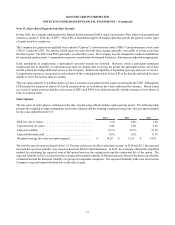
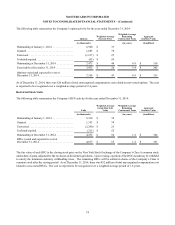
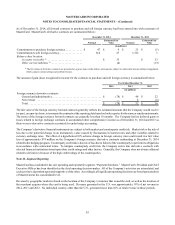
Performance Stock Units
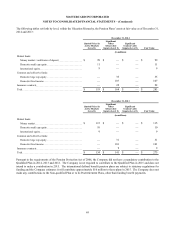
The following table summarizes the Company’s PSU activity for the year ended December 31, 2014:
Units
Weighted-Average
Grant-Date Fair
Value
Weighted-Average
Remaining
Contractual Term Aggregate
Intrinsic Value
(in thousands) (in years) (in millions)
Outstanding at January 1, 2014 . . . . . . . . . . . . . . . 787 $ 37 1
Granted . . . . . . . . . . . . . . . . . . . . . . . . . . . . . . . . . . 133 $ 78
Performance . . . . . . . . . . . . . . . . . . . . . . . . . . . . . . 19 $ 86
Converted . . . . . . . . . . . . . . . . . . . . . . . . . . . . . . . . (358) $ 82
Forfeited/expired. . . . . . . . . . . . . . . . . . . . . . . . . . . — $ —
Outstanding at December 31, 2014 . . . . . . . . . . . . 581 $ 74 0.9 $ 50
PSUs vested and expected to vest at
December 31, 2014. . . . . . . . . . . . . . . . . . . . . . . . . 568 $ 74 0.9 $ 49
1 For PSUs issued in 2012, the grant date was not established as of January 1, 2014 and thus issue-date fair value was used.
Since 2013, PSUs containing performance and market conditions have been issued. Performance measures used to determine the
actual number of shares that vest after three years include net revenue growth, EPS growth, and relative total shareholder return
(“TSR”). Relative TSR is considered a market condition, while net revenue and EPS growth are considered performance conditions.
The Monte Carlo simulation valuation model is used to determine the grant-date fair value.
The PSUs issued in 2012 contain performance conditions based on the Company’s performance against an annually predetermined
return on equity goal, with an average return on equity per year over the three-year period commencing on January 1 of the grant
year. The initial fair value of each PSU is the closing price on the New York Stock Exchange of the Company’s Class A common
stock on the date of issuance. Given that the performance conditions are subjective and not fixed on the date of issuance, these
PSUs will be remeasured at the end of each reporting period, at fair value, until the time the performance conditions are fixed and
the ultimate number of shares to be issued is determined. The grant-date fair value for each PSU issued in 2012 is $83.
Compensation expenses for PSUs are recognized over the requisite service period if it is probable that the performance target will
be achieved and subsequently adjusted if the probability assessment changes. As of December 31, 2014, there was $8 million of
total unrecognized compensation cost related to non-vested PSUs. The cost is expected to be recognized over a weighted-average
period of 1.6 years.