MasterCard 2014 Annual Report Download - page 30
Download and view the complete annual report
Please find page 30 of the 2014 MasterCard annual report below. You can navigate through the pages in the report by either clicking on the pages listed below, or by using the keyword search tool below to find specific information within the annual report.-
 1
1 -
2
-
3
-
4
-
5
-
6
-
7
-
8
-
9
-
10
-
11
-
12
-
13
-
14
-
15
-
16
-
17
-
18
-
19
-
 20
20 -
 21
21 -
 22
22 -
 23
23 -
 24
24 -
 25
25 -
 26
26 -
 27
27 -
 28
28 -
 29
29 -
 30
30 -
 31
31 -
 32
32 -
 33
33 -
 34
34 -
 35
35 -
 36
36 -
 37
37 -
 38
38 -
 39
39 -
 40
40 -
41
-
42
-
43
-
44
-
45
-
46
-
47
-
48
-
49
-
50
-
51
-
52
-
53
-
54
-
55
-
56
-
57
-
58
-
59
-
60
-
61
-
62
-
63
-
64
-
65
-
66
-
67
-
68
-
69
-
70
-
71
-
72
-
73
-
74
-
75
-
76
-
77
-
78
-
79
-
80
-
81
-
82
-
83
-
84
-
85
-
86
-
87
-
88
-
89
-
90
-
91
-
92
-
93
-
94
-
95
-
96
-
97
-
98
-
99
-
100
-
101
-
102
 |
 |

28
During the fourth quarter of 2014, MasterCard repurchased a total of approximately 2.1 million shares for $155 million at an
average price of $72.95 per share of Class A common stock. The Company’s repurchase activity during the fourth quarter of 2014
consisted of open market share repurchases and is summarized in the following table:
Period
Total Number
of Shares
Purchased
Average Price
Paid per Share
(including
commission cost)
Total Number of
Shares Purchased as
Part of Publicly
Announced Plans or
Programs
Dollar Value of
Shares that may yet
be Purchased under
the Plans or
Programs 1
October 1 – 31 . . . . . . . . . . . . . . . . . . . . . . . 2,045,900 $ 72.69 2,045,900 $ 281,633,768
November 1 – 30 . . . . . . . . . . . . . . . . . . . . . 78,500 $ 79.86 78,500 $ 275,364,960
December 1 – 31 . . . . . . . . . . . . . . . . . . . . . — $ — — $ 4,025,364,960
Total . . . . . . . . . . . . . . . . . . . . . . . . . . . . . . . 2,124,400 $ 72.95 2,124,400
1 Dollar value of shares that may yet be purchased under the December 2013 Share Repurchase Program and the December 2014 Share Repurchase
Program is as of the end of the period.
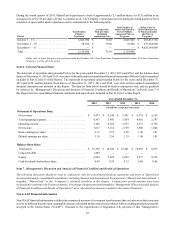
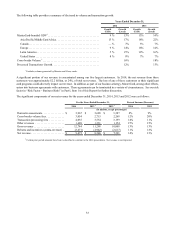
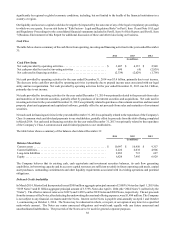
Item 6. Selected Financial Data
The statement of operations data presented below for the years ended December 31, 2014, 2013 and 2012, and the balance sheet
data as of December 31, 2014 and 2013, were derived from the audited consolidated financial statements of MasterCard Incorporated
included in Part II, Item 8 of this Report. The statement of operations data presented below for the years ended December 31,
2011 and 2010, and the balance sheet data as of December 31, 2012, 2011 and 2010, were derived from audited consolidated
financial statements not included in this Report. The data set forth below should be read in conjunction with, and are qualified
by reference to, “Management’s Discussion and Analysis of Financial Condition and Results of Operations” in Part II, Item 7 of
this Report and our consolidated financial statements and notes thereto included in Part II, Item 8 of this Report.
Years Ended December 31,
2014 2013 2012 2011 2010
(in millions, except per share data)
Statement of Operations Data:
Net revenue . . . . . . . . . . . . . . . . . . . . . . . . . . . . . . . . . . . . . . $ 9,473 $ 8,346 $ 7,391 $ 6,714 $ 5,539
Total operating expenses . . . . . . . . . . . . . . . . . . . . . . . . . . . . 4,367 3,843 3,454 4,001 2,787
Operating income. . . . . . . . . . . . . . . . . . . . . . . . . . . . . . . . . . 5,106 4,503 3,937 2,713 2,752
Net income. . . . . . . . . . . . . . . . . . . . . . . . . . . . . . . . . . . . . . . 3,617 3,116 2,759 1,906 1,846
Basic earnings per share. . . . . . . . . . . . . . . . . . . . . . . . . . . . . 3.11 2.57 2.20 1.49 1.41
Diluted earnings per share . . . . . . . . . . . . . . . . . . . . . . . . . . . 3.10 2.56 2.19 1.48 1.41
Balance Sheet Data:
Total assets. . . . . . . . . . . . . . . . . . . . . . . . . . . . . . . . . . . . . . . $ 15,329 $ 14,242 $ 12,462 $ 10,693 $ 8,837
Long-term debt. . . . . . . . . . . . . . . . . . . . . . . . . . . . . . . . . . . . 1,494 — — — —
Equity. . . . . . . . . . . . . . . . . . . . . . . . . . . . . . . . . . . . . . . . . . . 6,824 7,495 6,929 5,877 5,216
Cash dividends declared per share. . . . . . . . . . . . . . . . . . . . . 0.49 0.29 0.12 0.06 0.06
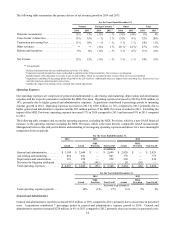
Item 7. Management’s Discussion and Analysis of Financial Condition and Results of Operations
The following discussion should be read in conjunction with the consolidated financial statements and notes of MasterCard
Incorporated and its consolidated subsidiaries, including MasterCard International Incorporated (“MasterCard International”)
(together, “MasterCard” or the “Company”), included elsewhere in this Report. Certain prior period amounts have been
reclassified to conform to the 2014 presentation. Percentage changes provided throughout “Management’s Discussion and Analysis
of Financial Condition and Results of Operations” were calculated on amounts rounded to the nearest thousand.
Non-GAAP Financial Information
Non-GAAP financial information is defined as a numerical measure of a company’s performance that excludes or includes amounts
so as to be different than the most comparable measure calculated and presented in accordance with accounting principles generally
accepted in the United States (“GAAP”). Pursuant to the requirements of Regulation S-K, portions of this “Management’s