MasterCard 2014 Annual Report Download - page 35
Download and view the complete annual report
Please find page 35 of the 2014 MasterCard annual report below. You can navigate through the pages in the report by either clicking on the pages listed below, or by using the keyword search tool below to find specific information within the annual report.-
 1
1 -
2
-
3
-
4
-
5
-
6
-
7
-
8
-
9
-
10
-
11
-
12
-
13
-
14
-
15
-
16
-
17
-
18
-
19
-
20
-
21
-
22
-
23
-
24
-
 25
25 -
 26
26 -
 27
27 -
 28
28 -
 29
29 -
 30
30 -
 31
31 -
 32
32 -
 33
33 -
 34
34 -
 35
35 -
 36
36 -
 37
37 -
 38
38 -
 39
39 -
 40
40 -
 41
41 -
 42
42 -
 43
43 -
 44
44 -
 45
45 -
46
-
47
-
48
-
49
-
50
-
51
-
52
-
53
-
54
-
55
-
56
-
57
-
58
-
59
-
60
-
61
-
62
-
63
-
64
-
65
-
66
-
67
-
68
-
69
-
70
-
71
-
72
-
73
-
74
-
75
-
76
-
77
-
78
-
79
-
80
-
81
-
82
-
83
-
84
-
85
-
86
-
87
-
88
-
89
-
90
-
91
-
92
-
93
-
94
-
95
-
96
-
97
-
98
-
99
-
100
-
101
-
102
 |
 |

33
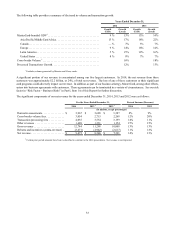
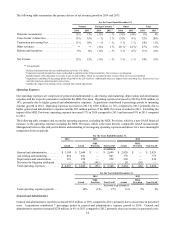
The following table provides a summary of the trend in volume and transaction growth:
Years Ended December 31,
2014 2013
Growth
(USD) Growth
(Local) Growth
(USD) Growth
(Local)
MasterCard-branded GDV 1. . . . . . . . . . . . . . . . . . . . . . . . . . . . . . . . . . . . . 9 % 13% 13% 14%
Asia Pacific/Middle East/Africa . . . . . . . . . . . . . . . . . . . . . . . . . . . . . . . 13 % 17% 18% 22%
Canada. . . . . . . . . . . . . . . . . . . . . . . . . . . . . . . . . . . . . . . . . . . . . . . . . . . — % 7% 3% 7%
Europe. . . . . . . . . . . . . . . . . . . . . . . . . . . . . . . . . . . . . . . . . . . . . . . . . . . 9 % 14% 16% 14%
Latin America . . . . . . . . . . . . . . . . . . . . . . . . . . . . . . . . . . . . . . . . . . . . . 5 % 15% 12% 16%
United States . . . . . . . . . . . . . . . . . . . . . . . . . . . . . . . . . . . . . . . . . . . . . . 8 % 8% 7% 7%
Cross-border Volume 1. . . . . . . . . . . . . . . . . . . . . . . . . . . . . . . . . . . . . . . . . 16% 18%
Processed Transactions Growth. . . . . . . . . . . . . . . . . . . . . . . . . . . . . . . . . . 12% 13%
1 Excludes volume generated by Maestro and Cirrus cards.
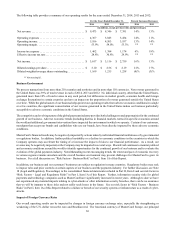
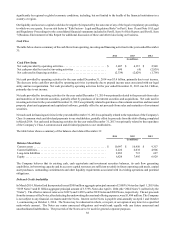
A significant portion of our revenue is concentrated among our five largest customers. In 2014, the net revenue from these
customers was approximately $2.2 billion, or 24%, of total net revenue. The loss of any of these customers or their significant
card programs could adversely impact our revenue. In addition, as part of our business strategy, MasterCard, among other efforts,
enters into business agreements with customers. These agreements can be terminated in a variety of circumstances. See our risk
factor in “Risk Factor - Business Risks” in Part I, Item 1A of this Report for further discussion.
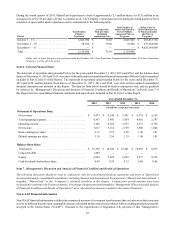
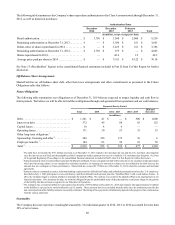
The significant components of our net revenue for the years ended December 31, 2014, 2013 and 2012 were as follows:
For the Years Ended December 31, Percent Increase (Decrease)
2014 2013 12012 12014 2013
(in millions, except percentages)
Domestic assessments. . . . . . . . . . . . . . . . $ 3,967 $ 3,688 $ 3,387 8% 9%
Cross-border volume fees . . . . . . . . . . . . . 3,054 2,715 2,268 12% 20%
Transaction processing fees . . . . . . . . . . . 4,035 3,554 3,199 14% 11%
Other revenues . . . . . . . . . . . . . . . . . . . . . 1,688 1,331 1,154 27% 15%
Gross revenue . . . . . . . . . . . . . . . . . . . . . . 12,744 11,288 10,008 13% 13%
Rebates and incentives (contra-revenue) . (3,271) (2,942) (2,617) 11% 12%
Net revenue . . . . . . . . . . . . . . . . . . . . . . . . $ 9,473 $ 8,346 $ 7,391 14% 13%
1 Certain prior period amounts have been reclassified to conform to the 2014 presentation. Net revenue is not impacted.