MasterCard 2014 Annual Report Download - page 40
Download and view the complete annual report
Please find page 40 of the 2014 MasterCard annual report below. You can navigate through the pages in the report by either clicking on the pages listed below, or by using the keyword search tool below to find specific information within the annual report.-
 1
1 -
2
-
3
-
4
-
5
-
6
-
7
-
8
-
9
-
10
-
11
-
12
-
13
-
14
-
15
-
16
-
17
-
18
-
19
-
20
-
21
-
22
-
23
-
24
-
25
-
26
-
27
-
28
-
29
-
 30
30 -
 31
31 -
 32
32 -
 33
33 -
 34
34 -
 35
35 -
 36
36 -
 37
37 -
 38
38 -
 39
39 -
 40
40 -
 41
41 -
 42
42 -
 43
43 -
 44
44 -
 45
45 -
 46
46 -
 47
47 -
 48
48 -
 49
49 -
 50
50 -
51
-
52
-
53
-
54
-
55
-
56
-
57
-
58
-
59
-
60
-
61
-
62
-
63
-
64
-
65
-
66
-
67
-
68
-
69
-
70
-
71
-
72
-
73
-
74
-
75
-
76
-
77
-
78
-
79
-
80
-
81
-
82
-
83
-
84
-
85
-
86
-
87
-
88
-
89
-
90
-
91
-
92
-
93
-
94
-
95
-
96
-
97
-
98
-
99
-
100
-
101
-
102
 |
 |

38
significantly by regional or global economic conditions, including, but not limited to the health of the financial institutions in a
country or region.
Our liquidity and access to capital could also be negatively impacted by the outcome of any of the legal or regulatory proceedings
to which we are a party. See our risk factor in “Risk Factors - Legal and Regulatory Risks” in Part I, Item 1A and Note 18 (Legal
and Regulatory Proceedings) to the consolidated financial statements included in Part II, Item 8 of this Report; and Part II, Item
7 (Business Environment) of this Report for additional discussion of these and other risks facing our business.
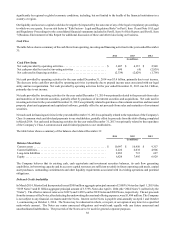
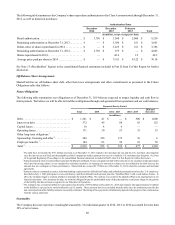
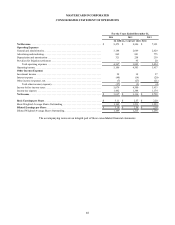
Cash Flow
The table below shows a summary of the cash flows from operating, investing and financing activities for the years ended December
31:
2014 2013 2012
(in millions)
Cash Flow Data:
Net cash provided by operating activities. . . . . . . . . . . . . . . . . . . . . . . . . . . . . . . $ 3,407 $ 4,135 $ 2,948
Net cash provided by (used in) investing activities . . . . . . . . . . . . . . . . . . . . . . . 690 (4) (2,839)
Net cash used in financing activities. . . . . . . . . . . . . . . . . . . . . . . . . . . . . . . . . . . (2,339) (2,629) (1,798)
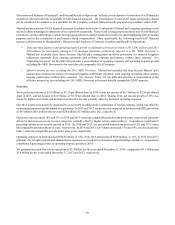
Net cash provided by operating activities for the year ended December 31, 2014 was $3.4 billion, primarily due to net income.
The decrease in the cash flow provided by operating activities is primarily due to prepaid income taxes associated with our legal
entity and tax reorganization. Net cash provided by operating activities for the year ended December 31, 2013 was $4.1 billion,
primarily due to net income.
Net cash provided by investing activities for the year ended December 31, 2014 was primarily related to the proceeds from sales
and maturities of investment securities, partially offset by purchases of investment securities and acquisitions. Net cash used in
investing activities for the year ended December 31, 2013 was primarily related to purchases of investment securities and increased
property, plant and equipment and capitalized software, partially offset by net proceeds from sales and maturities of investment
securities.
Net cash used in financing activities for the year ended December 31, 2014 was primarily related to the repurchase of the Company’s
Class A common stock and dividend payments to our stockholders, partially offset by proceeds from the debt offering completed
in March 2014. Net cash used in financing activities for the year ended December 31, 2013 was primarily related to the repurchase
of the Company’s Class A common stock and dividend payments to our stockholders.
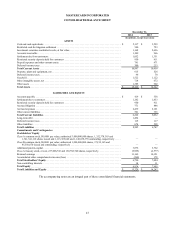
The table below shows a summary of the balance sheet data at December 31:
2014 2013 2012
(in millions)
Balance Sheet Data:
Current assets . . . . . . . . . . . . . . . . . . . . . . . . . . . . . . . . . . . . . . . . . . . . . . . . . . . . $ 10,997 $ 10,950 $ 9,357
Current liabilities. . . . . . . . . . . . . . . . . . . . . . . . . . . . . . . . . . . . . . . . . . . . . . . . . . 6,222 6,032 4,906
Long-term liabilities . . . . . . . . . . . . . . . . . . . . . . . . . . . . . . . . . . . . . . . . . . . . . . . 2,283 715 627
Equity . . . . . . . . . . . . . . . . . . . . . . . . . . . . . . . . . . . . . . . . . . . . . . . . . . . . . . . . . . 6,824 7,495 6,929
The Company believes that its existing cash, cash equivalents and investment securities balances, its cash flow generating
capabilities, its borrowing capacity and its access to capital resources are sufficient to satisfy its future operating cash needs, capital
asset purchases, outstanding commitments and other liquidity requirements associated with its existing operations and potential
obligations.
Debt and Credit Availability
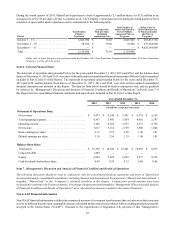
In March 2014, MasterCard Incorporated issued $500 million aggregate principal amount of 2.000% Notes due April 1, 2019 (the
“2019 Notes”) and $1 billion aggregate principal amount of 3.375% Notes due April 1, 2024 (the “2024 Notes”) (collectively the
“Notes”). The effective interest rates were 2.081% and 3.426% on the 2019 Notes and 2024 Notes, respectively. The net proceeds
from the issuance of the Notes, after deducting the underwriting discount and offering expenses, were $1,484 million. The Company
is not subject to any financial covenants under the Notes. Interest on the Notes is payable semi-annually on April 1 and October
1, commencing on October 1, 2014. The Notes may be redeemed in whole, or in part, at our option at any time for a specified
make-whole amount. The Notes are senior unsecured obligations and would rank equally with any future unsecured and
unsubordinated indebtedness. The proceeds of the Notes are to be used for general corporate purposes.