MasterCard 2014 Annual Report Download - page 33
Download and view the complete annual report
Please find page 33 of the 2014 MasterCard annual report below. You can navigate through the pages in the report by either clicking on the pages listed below, or by using the keyword search tool below to find specific information within the annual report.-
 1
1 -
2
-
3
-
4
-
5
-
6
-
7
-
8
-
9
-
10
-
11
-
12
-
13
-
14
-
15
-
16
-
17
-
18
-
19
-
20
-
21
-
22
-
 23
23 -
 24
24 -
 25
25 -
 26
26 -
 27
27 -
 28
28 -
 29
29 -
 30
30 -
 31
31 -
 32
32 -
 33
33 -
 34
34 -
 35
35 -
 36
36 -
 37
37 -
 38
38 -
 39
39 -
 40
40 -
 41
41 -
 42
42 -
 43
43 -
44
-
45
-
46
-
47
-
48
-
49
-
50
-
51
-
52
-
53
-
54
-
55
-
56
-
57
-
58
-
59
-
60
-
61
-
62
-
63
-
64
-
65
-
66
-
67
-
68
-
69
-
70
-
71
-
72
-
73
-
74
-
75
-
76
-
77
-
78
-
79
-
80
-
81
-
82
-
83
-
84
-
85
-
86
-
87
-
88
-
89
-
90
-
91
-
92
-
93
-
94
-
95
-
96
-
97
-
98
-
99
-
100
-
101
-
102
 |
 |
31
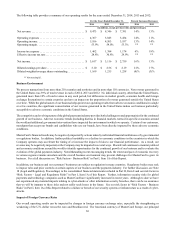
European operating subsidiary, is the euro, and the functional currency of our Brazilian subsidiary is the Brazilian real. Accordingly,
the strengthening or weakening of the U.S. dollar versus the euro and Brazilian real impacts the translation of our European and
Brazilian subsidiaries’ operating results into the U.S. dollar. For 2014 as compared to 2013 and for 2013 compared to 2012, the
U.S. dollar strengthened against the Brazilian real but weakened against the euro. The net foreign currency impact of changes in
the U.S. dollar average exchange rates against the euro and Brazilian real negatively impacted net income in 2014 by less than 1
percentage point as compared to 2013. Conversely, net income in 2013 was positively impacted by approximately 1 percentage
point as compared to 2012.
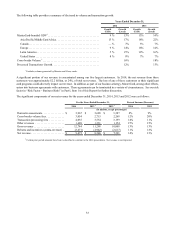
In addition, changes in foreign currency exchange rates directly impact the calculation of gross dollar volume (“GDV”) and gross
euro volume (“GEV”), which are used in the calculation of our domestic assessments, cross-border volume fees and volume related
rebates and incentives. In most non-European regions, GDV is calculated based on local currency spending volume converted to
U.S. dollars using average exchange rates for the period. In Europe, GEV is calculated based on local currency spending volume
converted to euros using average exchange rates for the period. As a result, our domestic assessments, cross-border volume fees
and volume related rebates and incentives are impacted by the strengthening or weakening of the U.S. dollar versus primarily non-
European local currencies and the strengthening or weakening of the euro versus primarily European local currencies. The
strengthening or weakening of the U.S. dollar is evident when GDV growth on a U.S. dollar converted basis is compared to GDV
growth on a local currency basis. In 2014, GDV on a U.S. dollar converted basis increased 9%, versus GDV growth on a local
currency basis of 13%. In 2013, GDV on a U.S. dollar converted basis increased 13%, versus GDV growth on a local currency
basis of 14%. The Company attempts to manage these foreign currency exposures through its foreign exchange risk management
activities, which are discussed further in Note 20 (Foreign Exchange Risk Management) to the consolidated financial statements
included in Part II, Item 8 of this Report.
The Company generates revenue and has financial assets in countries at risk for currency devaluation. While these revenues and
financial assets are not material to MasterCard on a consolidated basis, they could be negatively impacted if a devaluation of local
currencies occurs relative to the U.S. dollar.
Financial Results
Revenue
Revenue Description
MasterCard’s business model involves four participants in addition to us: cardholders, merchants, issuers (the cardholders’ financial
institutions) and acquirers (the merchants’ financial institutions). Our gross revenue is generated by assessing our customers based
primarily on the dollar volume of activity on the cards and other devices that carry our brands and from the fees that we charge
our customers for providing transaction processing and other payment-related products and services. Our revenue is based upon
transactional information accumulated by our systems or reported by our customers. Our primary revenue billing currencies are
the U.S. dollar, euro and Brazilian real.
The price structure for our products and services is complex and is dependent on the nature of volumes, types of transactions and
type of products and services we offer to our customers. Our net revenue can be significantly impacted by the following:
• domestic or cross-border transactions;
• signature-based or PIN-based transactions;
• geographic region or country in which the transaction occurs;
• volumes/transactions subject to tiered rates;
• processed or not processed by MasterCard;
• amount of usage of our other products or services; and
• amount of rebates and incentives provided to customers.
The Company classifies its net revenue into the following five categories:
1. Domestic assessments: Domestic assessments are fees charged to issuers and acquirers based primarily on the dollar
volume of activity on cards and other devices that carry our brands where the merchant country and the issuer country
are the same. Domestic assessments include items such as card assessments, which are fees charged on the number