MasterCard 2014 Annual Report Download - page 34
Download and view the complete annual report
Please find page 34 of the 2014 MasterCard annual report below. You can navigate through the pages in the report by either clicking on the pages listed below, or by using the keyword search tool below to find specific information within the annual report.-
 1
1 -
2
-
3
-
4
-
5
-
6
-
7
-
8
-
9
-
10
-
11
-
12
-
13
-
14
-
15
-
16
-
17
-
18
-
19
-
20
-
21
-
22
-
23
-
 24
24 -
 25
25 -
 26
26 -
 27
27 -
 28
28 -
 29
29 -
 30
30 -
 31
31 -
 32
32 -
 33
33 -
 34
34 -
 35
35 -
 36
36 -
 37
37 -
 38
38 -
 39
39 -
 40
40 -
 41
41 -
 42
42 -
 43
43 -
 44
44 -
45
-
46
-
47
-
48
-
49
-
50
-
51
-
52
-
53
-
54
-
55
-
56
-
57
-
58
-
59
-
60
-
61
-
62
-
63
-
64
-
65
-
66
-
67
-
68
-
69
-
70
-
71
-
72
-
73
-
74
-
75
-
76
-
77
-
78
-
79
-
80
-
81
-
82
-
83
-
84
-
85
-
86
-
87
-
88
-
89
-
90
-
91
-
92
-
93
-
94
-
95
-
96
-
97
-
98
-
99
-
100
-
101
-
102
 |
 |

32
of cards issued or assessments for specific purposes, such as acceptance development or market development
programs.
2. Cross-border volume fees: Cross-border volume fees are charged to issuers and acquirers based on the dollar volume
of activity on cards and other devices that carry our brands where the merchant country and the issuer country are
different. In general, a cross-border transaction generates higher revenue than a domestic transaction since cross-
border fees are higher than domestic fees, and in most cases also include fees for currency conversion.
3. Transaction processing fees: Transaction processing fees are charged for both domestic and cross-border
transactions and are primarily based on the number of transactions. Transaction processing fees include charges to
issuers for the following:
• Transaction Switching fees for the following products and services:
Authorization is the process by which a transaction is routed to the issuer for approval. In certain
circumstances such as when the issuer’s systems are unavailable or cannot be contacted,
MasterCard or others, on behalf of the issuer approve in accordance with either the issuer’s
instructions or applicable rules (also known as “stand-in”).
Clearing is the exchange of financial transaction information between issuers and acquirers after
a transaction has been successfully conducted at the point of interaction. MasterCard clears
transactions among customers through our central and regional processing systems.
Settlement is facilitating the exchange of funds between parties.
• Connectivity fees are charged to issuers and acquirers for network access, equipment and the transmission
of authorization and settlement messages. These fees are based on the size of the data being transmitted
through and the number of connections to the Company’s network.
4. Other revenues: Other revenues consist of other payment-related products and services and are primarily associated
with the following:
• Consulting and research fees are primarily generated by MasterCard Advisors, the Company’s professional
advisory services group.
• Fraud products and services used to prevent or detect fraudulent transactions. This includes fees for warning
bulletins provided to issuers and acquirers either electronically or in paper form.
• Loyalty and rewards solutions fees are charged to issuers for benefits provided directly to consumers with
MasterCard-branded cards, such as insurance, assistance for lost cards, locating ATMs and rewards
programs.
• Program management services provided to prepaid card issuers consist of foreign exchange margin,
commissions, load fees, and ATM withdrawal fees paid by cardholders on the sale and encashment of prepaid
cards.
• The Company also charges for a variety of other payment-related products and services, including account
and transaction enhancement services, rules compliance and publications.
5. Rebates and incentives (contra-revenue): Rebates and incentives are provided to certain MasterCard customers
and are recorded as contra-revenue.
Revenue Analysis
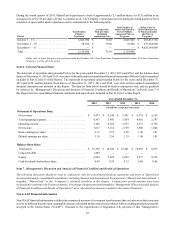
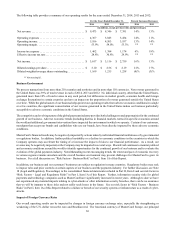
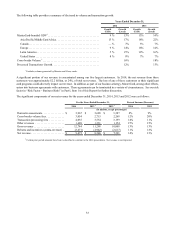
Gross revenue in 2014 and 2013 increased $1.5 billion and $1.3 billion, or 13% versus 2013 and 2012, respectively, driven by an
increase in dollar volume of activity on cards carrying our brands, transactions, other payment-related products and services and
the impact of acquisitions. Rebates and incentives in 2014 and 2013 increased $329 million and $325 million, or 11% and 12%,
versus 2013 and 2012, respectively, due to the impact from new and renewed agreements and increased volumes. Our net revenue
in 2014 and 2013 increased 14% and 13% versus 2013 and 2012, respectively. Acquisitions contributed 2 percentage points to
net revenue growth in 2014. In 2014 and 2013, our GDV increased 13% and 14% on a local currency basis while our processed
transactions increased 12% and 13%, respectively.