MasterCard 2014 Annual Report Download - page 36
Download and view the complete annual report
Please find page 36 of the 2014 MasterCard annual report below. You can navigate through the pages in the report by either clicking on the pages listed below, or by using the keyword search tool below to find specific information within the annual report.-
 1
1 -
2
-
3
-
4
-
5
-
6
-
7
-
8
-
9
-
10
-
11
-
12
-
13
-
14
-
15
-
16
-
17
-
18
-
19
-
20
-
21
-
22
-
23
-
24
-
25
-
 26
26 -
 27
27 -
 28
28 -
 29
29 -
 30
30 -
 31
31 -
 32
32 -
 33
33 -
 34
34 -
 35
35 -
 36
36 -
 37
37 -
 38
38 -
 39
39 -
 40
40 -
 41
41 -
 42
42 -
 43
43 -
 44
44 -
 45
45 -
 46
46 -
47
-
48
-
49
-
50
-
51
-
52
-
53
-
54
-
55
-
56
-
57
-
58
-
59
-
60
-
61
-
62
-
63
-
64
-
65
-
66
-
67
-
68
-
69
-
70
-
71
-
72
-
73
-
74
-
75
-
76
-
77
-
78
-
79
-
80
-
81
-
82
-
83
-
84
-
85
-
86
-
87
-
88
-
89
-
90
-
91
-
92
-
93
-
94
-
95
-
96
-
97
-
98
-
99
-
100
-
101
-
102
 |
 |

34
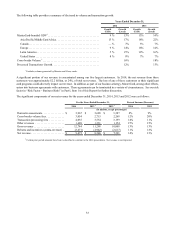
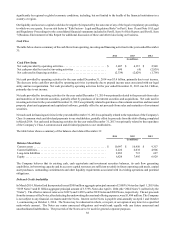
The following table summarizes the primary drivers of net revenue growth in 2014 and 2013:
For the Years Ended December 31,
Volume Foreign Currency 1Other Total
2014 2013 22014 2013 22014 2013 22014 2013 2
Domestic assessments . . . . . . . . . . . . . . . . . . . . . 12% 13% (1)% — % (3)% 3(4)% 38% 9%
Cross-border volume fees. . . . . . . . . . . . . . . . . . . 15% 15% — % 1 % (3)% 4 % 12% 20%
Transaction processing fees . . . . . . . . . . . . . . . . . 11% 10% — % — % 3 % 1 % 14% 11%
Other revenues . . . . . . . . . . . . . . . . . . . . . . . . . . . ** ** (1)% 1 % 28 % 414 % 427% 15%
Rebates and incentives . . . . . . . . . . . . . . . . . . . . . 9% 8% (1)% — % 3 % 54 % 511% 12%
Net revenue . . . . . . . . . . . . . . . . . . . . . . . . . . . . . 12% 12% (1)% — % 3 % 1 % 14% 13%
** Not applicable
1 Reflects translation from the euro and Brazilian real to the U.S. dollar.
2 Certain prior period amounts have been reclassified to conform to the 2014 presentation. Net revenue is not impacted.
3 Includes impact of the allocation of revenue to service deliverables, which are recorded in other revenue when services are performed.
4 Acquisitions contributed 8 percentage points of growth to the 2014 activity. Additionally there are impacts from consulting fees, fraud service fees
and other payment-related products and services.
5 Includes the impact from timing of new, renewed and expired agreements.
Operating Expenses
Our operating expenses are comprised of general and administrative, advertising and marketing, depreciation and amortization
expenses and the respective amounts recorded for the MDL Provision. Operating expenses increased in 2014 by $524 million, or
14%, primarily due to higher general and administrative expenses. Acquisitions contributed 6 percentage points to operating
expense growth in 2014. Operating expenses increased in 2013 by $389 million, or 11% compared to 2012, primarily due to
higher general and administrative expenses and the $95 million portion of the MDL Provision recorded in 2013. Excluding the
impact of the MDL Provision, operating expenses increased 17% in 2014 compared to 2013 and increased 9% in 2013 compared
to 2012.
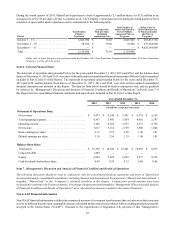
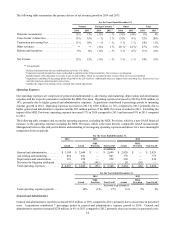
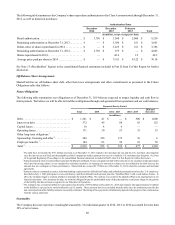
The following table compares and reconciles operating expenses, excluding the MDL Provision, which is a non-GAAP financial
measure, to the operating expenses including the MDL Provision, which is the most directly comparable GAAP measurement.
Management believes this analysis facilitates understanding of our ongoing operating expenses and allows for a more meaningful
comparison between periods.
For the Years Ended December 31,
2014 2013 2012
Actual Actual MDL
Provision Non-GAAP Actual MDL
Provision Non-GAAP
(in millions)
General and administrative. . . . . . . . . $ 3,184 $ 2,649 $ — $ 2,649 $ 2,429 $ — $ 2,429
Advertising and marketing. . . . . . . . . 862 841 — 841 775 — 775
Depreciation and amortization . . . . . . 321 258 — 258 230 — 230
Provision for litigation settlement . . . — 95 (95) — 20 (20) —
Total operating expenses . . . . . . . . . . $ 4,367 $ 3,843 $ (95) $ 3,748 $ 3,454 $ (20) $ 3,434
For the Years Ended December 31,
2014 2013
Actual MDL
Provision Non-GAAP Actual MDL
Provision Non-GAAP
Year-over-year Growth %
Total operating expenses growth . . . . 14% (3)% 17% 11% 2% 9%
General and Administrative
General and administrative expenses increased $535 million, or 20% compared to 2013, primarily due to an increase in personnel
costs. Acquisitions contributed 7 percentage points to general and administrative expense growth in 2014. General and
administrative expenses increased $220 million, or 9% in 2013 compared to 2012, primarily due to an increase in personnel costs.