MasterCard 2014 Annual Report Download - page 31
Download and view the complete annual report
Please find page 31 of the 2014 MasterCard annual report below. You can navigate through the pages in the report by either clicking on the pages listed below, or by using the keyword search tool below to find specific information within the annual report.-
 1
1 -
2
-
3
-
4
-
5
-
6
-
7
-
8
-
9
-
10
-
11
-
12
-
13
-
14
-
15
-
16
-
17
-
18
-
19
-
20
-
 21
21 -
 22
22 -
 23
23 -
 24
24 -
 25
25 -
 26
26 -
 27
27 -
 28
28 -
 29
29 -
 30
30 -
 31
31 -
 32
32 -
 33
33 -
 34
34 -
 35
35 -
 36
36 -
 37
37 -
 38
38 -
 39
39 -
 40
40 -
 41
41 -
42
-
43
-
44
-
45
-
46
-
47
-
48
-
49
-
50
-
51
-
52
-
53
-
54
-
55
-
56
-
57
-
58
-
59
-
60
-
61
-
62
-
63
-
64
-
65
-
66
-
67
-
68
-
69
-
70
-
71
-
72
-
73
-
74
-
75
-
76
-
77
-
78
-
79
-
80
-
81
-
82
-
83
-
84
-
85
-
86
-
87
-
88
-
89
-
90
-
91
-
92
-
93
-
94
-
95
-
96
-
97
-
98
-
99
-
100
-
101
-
102
 |
 |
29
Discussion and Analysis of Financial Condition and Results of Operations” include a reconciliation of certain non-GAAP financial
measures to the most directly comparable GAAP financial measures. The presentation of non-GAAP financial measures should
not be considered in isolation or as a substitute for the Company’s related financial results prepared in accordance with GAAP.
MasterCard presents non-GAAP financial measures to enhance an investor’s evaluation of MasterCard’s ongoing operating results
and to facilitate meaningful comparison of its results between periods. MasterCard’s management uses these non-GAAP financial
measures to, among other things, evaluate its ongoing operations in relation to historical results, for internal planning and forecasting
purposes and in the calculation of performance-based compensation. More specifically, the following non-GAAP financial
measures are presented in Management’s Discussion and Analysis of Financial Condition and Results of Operations:
• Total operating expenses and operating expense growth excluding the provision recorded in 2013 ($95 million) and 2012
($20 million) for settlements relating to U.S. merchant litigations (collectively referred to as the “MDL Provision”).
MasterCard excluded these items because MasterCard’s management monitors provisions for material litigation
settlements separately from ongoing operations and evaluates ongoing performance without these amounts. See
“Operating Expenses” for the table that provides a reconciliation of operating expenses and operating expense growth
excluding the MDL Provisions to the most directly comparable GAAP measure.
• Effective income tax rate excluding the 2013 MDL Provision. MasterCard excluded this item because MasterCard’s
management monitors provisions for material litigation settlements separately from ongoing operations and evaluates
ongoing performance without these amounts. See “Income Taxes” for the table that provides a reconciliation of the
effective income tax rate excluding the 2013 MDL Provision to the most directly comparable GAAP measure.
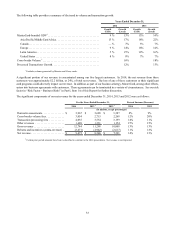
Overview
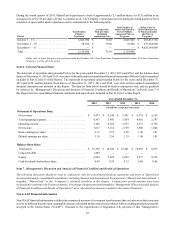
We recorded net income of $3.6 billion, or $3.10 per diluted share in 2014 versus net income of $3.1 billion, or $2.56 per diluted
share in 2013, and net income of $2.8 billion, or $2.19 per diluted share in 2012. During 2014, net income growth of 16% was
driven by higher net revenue and an improved effective tax rate, partially offset by increased operating expenses.
Our 2014 results were positively impacted by a tax benefit resulting from a repatriation of foreign earnings, which was offset by
restructuring expenses and the impact of acquisitions. In 2013 and 2012, net income was impacted by the increased MDL provisions
of $95 million ($61 million after tax) and $20 million ($13 million after tax), respectively.
Our net revenue increased 14% and 13% in 2014 and 2013 versus the comparable periods in the prior years, respectively, primarily
driven by increases across our revenue categories, partially offset by higher rebates and incentives. Acquisitions contributed 2
percentage points to net revenue growth in 2014. In 2014 and 2013, our processed transactions increased 12% and 13% versus
the comparable periods in the prior years, respectively. In 2014 and 2013, our volumes increased 13% and 14%, on a local currency
basis, versus the comparable periods in the prior years, respectively.
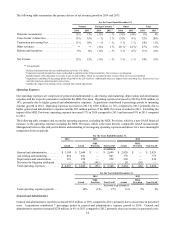
Operating expenses in 2014 increased $524 million, or 14%, from 2013 and increased $389 million, or 11%, in 2013 from 2012
primarily due to higher general and administrative expenses as a result of investments to support strategic initiatives. Acquisitions
contributed 6 percentage points to operating expense growth in 2014.
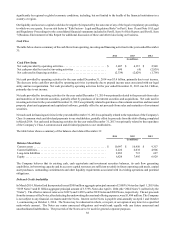
We generated net cash flows from operations of $3.4 billion for the year ended December 31, 2014, compared to $4.1 billion and
$2.9 billion for the years ended December 31, 2013 and 2012, respectively.