MasterCard 2014 Annual Report Download - page 69
Download and view the complete annual report
Please find page 69 of the 2014 MasterCard annual report below. You can navigate through the pages in the report by either clicking on the pages listed below, or by using the keyword search tool below to find specific information within the annual report.-
 1
1 -
2
-
3
-
4
-
5
-
6
-
7
-
8
-
9
-
10
-
11
-
12
-
13
-
14
-
15
-
16
-
17
-
18
-
19
-
20
-
21
-
22
-
23
-
24
-
25
-
26
-
27
-
28
-
29
-
30
-
31
-
32
-
33
-
34
-
35
-
36
-
37
-
38
-
39
-
40
-
41
-
42
-
43
-
44
-
45
-
46
-
47
-
48
-
49
-
50
-
51
-
52
-
53
-
54
-
55
-
56
-
57
-
58
-
 59
59 -
 60
60 -
 61
61 -
 62
62 -
 63
63 -
 64
64 -
 65
65 -
 66
66 -
 67
67 -
 68
68 -
 69
69 -
 70
70 -
 71
71 -
 72
72 -
 73
73 -
 74
74 -
 75
75 -
 76
76 -
 77
77 -
 78
78 -
 79
79 -
80
-
81
-
82
-
83
-
84
-
85
-
86
-
87
-
88
-
89
-
90
-
91
-
92
-
93
-
94
-
95
-
96
-
97
-
98
-
99
-
100
-
101
-
102
 |
 |

MASTERCARD INCORPORATED
NOTES TO CONSOLIDATED FINANCIAL STATEMENTS – (Continued)
67
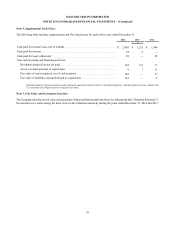
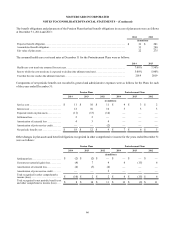
The estimated amounts that are expected to be amortized from accumulated other comprehensive income into net periodic benefit
cost in 2015 are as follows:
Pension Plans Postretirement
Plans
(in millions)
Actuarial loss. . . . . . . . . . . . . . . . . . . . . . . . . . . . . . . . . . . . . . . . . . . . . . . . . . . . . . . . . . . . . . . . . . . . . . . $ 2 $ —
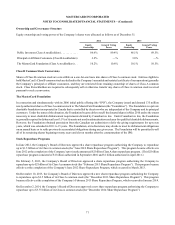
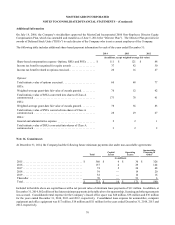
Weighted-average assumptions used to determine net periodic benefit cost were as follows for the years ended December 31:
Pension Plans Postretirement Plans
2014 2013 2012 2014 2013 2012
Discount rate . . . . . . . . . . . . . . . . . . . . . . . . 3.80% 3.30% 4.25% 4.75% 3.75% 4.25%
Expected return on plan assets. . . . . . . . . . . 3.30% 3.30% 6.00% * * *
Rate of compensation increase:
Qualified Plan . . . . . . . . . . . . . . . . . . . . . . * * 5.35% * * *
Non-qualified Plan. . . . . . . . . . . . . . . . . . . 5.00% 5.00% 5.00% * * *
International pension plans . . . . . . . . . . . . 2.85% 2.25% * * * *
Postretirement Plans . . . . . . . . . . . . . . . . . * * * 3.00% 5.35% 5.35%
* Not applicable
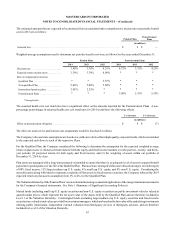
The assumed health care cost trend rates have a significant effect on the amounts reported for the Postretirement Plans. A one-
percentage point change in assumed health care cost trend rates for 2014 would have the following effects:
1% increase 1% decrease
(in millions)
Effect on postretirement obligation. . . . . . . . . . . . . . . . . . . . . . . . . . . . . . . . . . . . . . . . . . . . . . . . . . . . . . $ 8 $ (7)
The effect on total service and interest cost components would be less than $1 million.
The Company’s discount rate assumptions are based on a yield curve derived from high quality corporate bonds, which are matched
to the expected cash flows to each of the respective Plans.
For the Qualified Plan, the Company considered the following to determine the assumption for the expected weighted-average
return on plan assets: (1) historical return data for both the equity and fixed income markets over the past ten-, twenty- and thirty-
year periods; (2) projected returns for both equity and fixed income; and (3) the weighting of assets within our portfolio at
December 31, 2014 by class.
Plan assets are managed with a long-term perspective intended to ensure that there is an adequate level of assets to support benefit
payments to participants over the life of the Qualified Plan. Plan assets are managed within asset allocation ranges, towards targets
of 80% fixed income, 12% large/medium cap U.S. equity, 4% small cap U.S. equity, and 4% non-U.S. equity. Considering the
asset allocation along with intent to maintain a majority of Plan assets in fixed income securities, the Company reduced the 2014
expected return on plan assets assumption from 5% to 4% for the Qualified Plan.
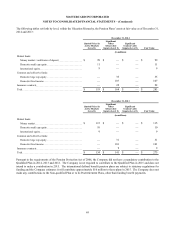
The Valuation Hierarchy of the Pension Plans’ assets is determined using a consistent application of the categorization measurements
for the Company’s financial instruments. See Note 1 (Summary of Significant Accounting Policies).
Mutual funds (including small cap U.S. equity securities and non-U.S. equity securities) are public investment vehicles valued at
quoted market prices, which represent the net asset value of the shares held by the Qualified Plan and are therefore included in
Level 1 of the Valuation Hierarchy. Commingled funds (including large/medium cap U.S. equity securities and fixed income
securities) are valued at unit values provided by investment managers, which are based on the fair value of the underlying investments
utilizing public information, independent external valuation from third-party services or third-party advisors, and are therefore
included in Level 2 of the Valuation Hierarchy.