Kraft 2001 Annual Report Download - page 47
Download and view the complete annual report
Please find page 47 of the 2001 Kraft annual report below. You can navigate through the pages in the report by either clicking on the pages listed below, or by using the keyword search tool below to find specific information within the annual report.-
 1
1 -
2
-
3
-
4
-
5
-
6
-
7
-
8
-
9
-
10
-
11
-
12
-
13
-
14
-
15
-
16
-
17
-
18
-
19
-
20
-
21
-
22
-
23
-
24
-
25
-
26
-
27
-
28
-
29
-
30
-
31
-
32
-
33
-
34
-
35
-
36
-
 37
37 -
 38
38 -
 39
39 -
 40
40 -
 41
41 -
 42
42 -
 43
43 -
 44
44 -
 45
45 -
 46
46 -
 47
47 -
 48
48 -
 49
49 -
 50
50 -
 51
51 -
 52
52 -
 53
53 -
 54
54 -
 55
55 -
 56
56 -
 57
57 -
58
-
59
-
60
-
61
-
62
-
63
-
64
-
65
-
66
 |
 |
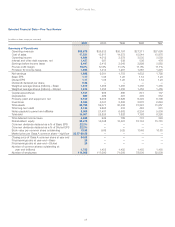
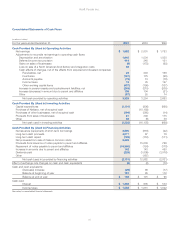
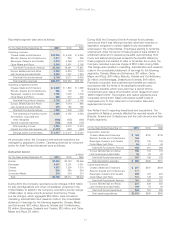
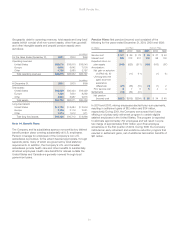
Kraft Foods Inc.
41
(in millions of dollars)
For the years ended December 31, 2001 2000 1999
Cash Provided By (Used In) Operating Activities
Net earnings $ 1,882 $ 2,001 $ 1,753
Adjustments to reconcile net earnings to operating cash flows:
Depreciation and amortization 1,642 1,034 1,030
Deferred income tax provision 414 245 151
Gains on sales of businesses (8) (172) (62)
Loss on sale of a North American food factory and integration costs 82
Cash effects of changes, net of the effects from acquired and divested companies:
Receivables, net 23 204 156
Inventories (107) 175 (95)
Accounts payable (73) 13 (18)
Income taxes 74 35 127
Other working capital items (407) (195) (137)
Increase in pension assets and postretirement liabilities, net (245) (215) (205)
Increase (decrease) in amount due to parent and affiliates 138 104 (21)
Other (87) 25 14
Net cash provided by operating activities 3,328 3,254 2,693
Cash Provided By (Used In) Investing Activities
Capital expenditures (1,101) (906) (860)
Purchase of Nabisco, net of acquired cash (15,159)
Purchases of other businesses, net of acquired cash (194) (365) (14)
Proceeds from sales of businesses 21 300 175
Other 52 (8) 30
Net cash used in investing activities (1,222) (16,138) (669)
Cash Provided By (Used In) Financing Activities
Net issuance (repayment) of short-term borrowings 2,505 (816) (22)
Long-term debt proceeds 4,077 87 78
Long-term debt repaid (705) (112) (111)
Net proceeds from sale of Class A common stock 8,425
Proceeds from issuance of notes payable to parent and affiliates 15,000 768
Repayment of notes payable to parent and affiliates (16,350) (124) (178)
Increase in amounts due to parent and affiliates 142 143 450
Dividends paid (225) (1,009) (3,016)
Other (187)
Net cash (used in) provided by financing activities (2,131) 12,982 (2,031)
Effect of exchange rate changes on cash and cash equivalents (4) (2) (10)
Cash and cash equivalents:
(Decrease) increase (29) 96 (17)
Balance at beginning of year 191 95 112
Balance at end of year $ 162 $ 191 $ 95
Cash paid:
Interest $ 1,433 $ 605 $ 533
Income taxes $ 1,058 $ 1,051 $ 1,022
See notes to consolidated financial statements.
Consolidated Statements of Cash Flows