Kraft 2001 Annual Report Download - page 24
Download and view the complete annual report
Please find page 24 of the 2001 Kraft annual report below. You can navigate through the pages in the report by either clicking on the pages listed below, or by using the keyword search tool below to find specific information within the annual report.-
 1
1 -
2
-
3
-
4
-
5
-
6
-
7
-
8
-
9
-
10
-
11
-
12
-
13
-
 14
14 -
 15
15 -
 16
16 -
 17
17 -
 18
18 -
 19
19 -
 20
20 -
 21
21 -
 22
22 -
 23
23 -
 24
24 -
 25
25 -
 26
26 -
 27
27 -
 28
28 -
 29
29 -
 30
30 -
 31
31 -
 32
32 -
 33
33 -
 34
34 -
35
-
36
-
37
-
38
-
39
-
40
-
41
-
42
-
43
-
44
-
45
-
46
-
47
-
48
-
49
-
50
-
51
-
52
-
53
-
54
-
55
-
56
-
57
-
58
-
59
-
60
-
61
-
62
-
63
-
64
-
65
-
66
 |
 |

18
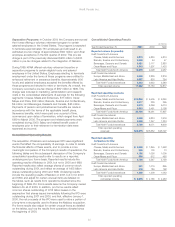
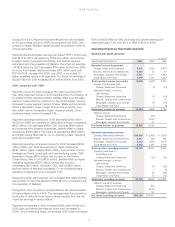
2001 Financial Highlights
Consolidated Results
Reported Pro Forma
(in millions, except per share data) 2001 2000 % Change 2001 2000 %Change
Volume (in pounds) 17,392 13,130 32.5% 17,374 16,747 3.7%
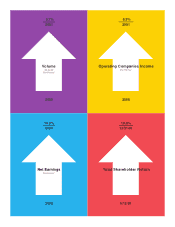
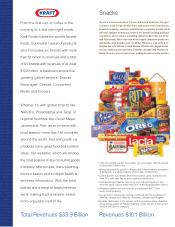
Operating revenues $33,875 $26,532 27.7 $33,871 $34,033 (0.5)
Operating companies income 6,035 4,755 26.9 6,116 5,616 8.9
Net earnings 1,882 2,001 (5.9) 2,092 1,745 19.9
Diluted earnings per share 1.17 1.38 (15.2) 1.21 1.01 19.8
Results by Business Segment
North America
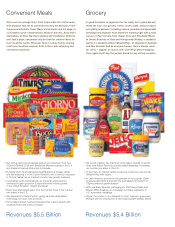
Cheese, Meals and Enhancers
Operating revenues $10,256 $ 9,405 9.0% $10,256 $10,272 (0.2%)
Operating companies income 2,099 1,845 13.8 2,162 2,057 5.1
Biscuits, Snacks and Confectionery
Operating revenues 5,917 329 100+5,917 5,761 2.7
Operating companies income 966 100 100 +968 777 24.6
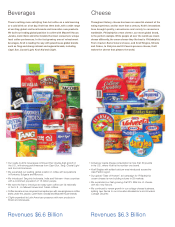
Beverages, Desserts and Cereals
Operating revenues 5,370 5,266 2.0 5,370 5,395 (0.5)
Operating companies income 1,192 1,090 9.4 1,204 1,125 7.0
Oscar Mayer and Pizza
Operating revenues 3,563 3,461 2.9 3,563 3,473 2.6
Operating companies income 539 512 5.3 544 516 5 .4
Total North America
Operating revenues $25,106 $ 18,461 36.0% $25,106 $24,901 0.8%
Operating companies income 4,796 3,547 35.2 4,878 4,475 9.0
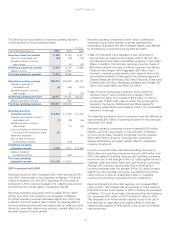
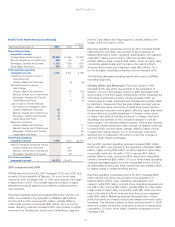
International
Europe, Middle East and Africa
Operating revenues $ 6,339 $ 6,824 (7.1%) $ 6,339 $ 6,754 (6.1%)
Operating companies income 861 1,019 (15.5) 861 857 0.5
Latin America and Asia Pacific
Operating revenues 2,430 1,247 94.9 2,426 2,378 2.0
Operating companies income 378 189 100.0 377 284 32.7
Total International
Operating revenues $8,769 $8,071 8.6% $ 8,765 $ 9,132 (4.0%)
Operating companies income 1,239 1,208 2.6 1,238 1,141 8.5
Total Kraft Foods
Operating revenues $33,875 $26,532 27.7% $33,871 $34,033 (0.5%)
Operating companies income 6,035 4,755 26.9 6,116 5,616 8.9
Reported results include the operating results of Nabisco in 2001, but not in 2000. Reported results also reflect average shares of common stock
outstanding during 2001 and assume an average of 1.455 billion shares outstanding during 2000.
Pro forma results assume Kraft owned Nabisco for all of 2000. In addition, pro forma results reflect common shares outstanding of 1.735 billion
based on the assumption that shares issued immediately following the Kraft initial public offering (IPO) were outstanding during all periods
presented and that, effective January 1, 2000, the net proceeds of the IPO were used to retire indebtedness incurred to finance the Nabisco
acquisition. These results also exclude significant one-time items for loss on sale of a factory and integration costs, estimated sales made in
advance of the century date change, gain on sale of a business, and results from operations divested since the beginning of 2000.
Results for fiscal year 2001 are based on a traditional 52-week year while fiscal year 2000 results reflect a 53-week year.
Pro forma volume results shown above and volume comparisons elsewhere in this report exclude the impact of the 53rd week in 2000
for a more meaningful comparison.
*
**