Kraft 2001 Annual Report Download - page 44
Download and view the complete annual report
Please find page 44 of the 2001 Kraft annual report below. You can navigate through the pages in the report by either clicking on the pages listed below, or by using the keyword search tool below to find specific information within the annual report.-
 1
1 -
2
-
3
-
4
-
5
-
6
-
7
-
8
-
9
-
10
-
11
-
12
-
13
-
14
-
15
-
16
-
17
-
18
-
19
-
20
-
21
-
22
-
23
-
24
-
25
-
26
-
27
-
28
-
29
-
30
-
31
-
32
-
33
-
 34
34 -
 35
35 -
 36
36 -
 37
37 -
 38
38 -
 39
39 -
 40
40 -
 41
41 -
 42
42 -
 43
43 -
 44
44 -
 45
45 -
 46
46 -
 47
47 -
 48
48 -
 49
49 -
 50
50 -
 51
51 -
 52
52 -
 53
53 -
 54
54 -
55
-
56
-
57
-
58
-
59
-
60
-
61
-
62
-
63
-
64
-
65
-
66
 |
 |
Kraft Foods Inc.
38
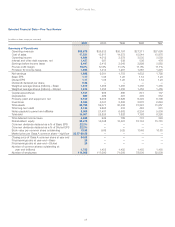
Selected Financial Data
—
Five-Year Review
(in millions of dollars, except per share data)
2001 2000 1999 1998 1997
Summary of Operations:
Operating revenues $33,875 $26,532 $26,797 $27,311 $27,690
Cost of sales 17,531 13,917 14,573 15,544 15,978
Operating income 4,884 4,012 3,579 3,535 3,559
Interest and other debt expense, net 1,437 597 539 536 476
Earnings before income taxes 3,447 3,415 3,040 2,999 3,083
Pre-tax profit margin 10.2% 12.9% 11.3% 11.0% 11.1%
Provision for income taxes 1,565 1,414 1,287 1,367 1,291
Net earnings 1,882 2,001 1,753 1,632 1,792
Basic EPS 1.17 1.38 1.20 1.12 1.23
Diluted EPS 1.17 1.38 1.20 1.12 1.23
Dividends declared per share 0.26
————
Weighted average shares (millions)
—
Basic 1,610 1,455 1,455 1,455 1,455
Weighted average shares (millions)
—
Diluted 1,610 1,455 1,455 1,455 1,455
Capital expenditures 1,101 906 860 841 737
Depreciation 680 499 491 494 512
Property, plant and equipment, net 9,109 9,405 6,526 6,494 6,198
Inventories 3,026 3,041 2,563 2,570 2,643
Total assets 55,798 52,071 30,336 31,391 31,257
Total long-term debt 8,134 2,695 433 483 531
Notes payable to parent and affiliates 5,000 21,407 6,602 6,234 5,000
Total debt 16,007 25,826 7,828 7,168 6,393
Total deferred income taxes 4,565 942 789 707 340
Shareholders’ equity 23,478 14,048 13,461 15,134 15,761
Common dividends declared as a % of Basic EPS 22.2%
————
Common dividends declared as a % of Diluted EPS 22.2%
————
Book value per common share outstanding 13.53 9.65 9.25 10.40 10.83
Market price per Class A common share
—
high/low 35.57-29.50
————
Closing price of Class A common share at year end 34.03
————
Price/earnings ratio at year end
—
Basic 29
————
Price/earnings ratio at year end
—
Diluted 29
————
Number of common shares outstanding at
year end (millions) 1,735 1,455 1,455 1,455 1,455
Number of employees 114,000 117,000 71,000 78,000 82,000