Kraft 2001 Annual Report Download - page 36
Download and view the complete annual report
Please find page 36 of the 2001 Kraft annual report below. You can navigate through the pages in the report by either clicking on the pages listed below, or by using the keyword search tool below to find specific information within the annual report.-
 1
1 -
2
-
3
-
4
-
5
-
6
-
7
-
8
-
9
-
10
-
11
-
12
-
13
-
14
-
15
-
16
-
17
-
18
-
19
-
20
-
21
-
22
-
23
-
24
-
25
-
 26
26 -
 27
27 -
 28
28 -
 29
29 -
 30
30 -
 31
31 -
 32
32 -
 33
33 -
 34
34 -
 35
35 -
 36
36 -
 37
37 -
 38
38 -
 39
39 -
 40
40 -
 41
41 -
 42
42 -
 43
43 -
 44
44 -
 45
45 -
 46
46 -
47
-
48
-
49
-
50
-
51
-
52
-
53
-
54
-
55
-
56
-
57
-
58
-
59
-
60
-
61
-
62
-
63
-
64
-
65
-
66
 |
 |

Kraft Foods Inc.
30
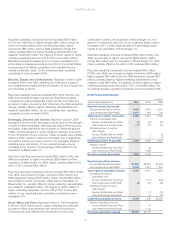
Reported operating companies income increased $187 million
(11.3%) over 1999 due to higher margins ($254 million, driven by
lower commodity-related and manufacturing costs), higher
volume/mix ($67 million) and the 1999 separation charge ($71
million), partially offset by higher marketing, administration and
research costs ($171 million, the majority of which related to higher
marketing expenses) and the shift in CDC income ($30 million).
Marketing expense increased as the Company increased price
promotions on cheese products during 2000 in the United States
during a period of intense competition that resulted from low
cheese commodity costs. On an underlying basis, operating
companies income increased 8.8%.
Biscuits, Snacks and Confectionery: Reported volume in 2000
increased 14.9% over 1999, reflecting the continued success of
two-compartment snacks and the introduction of new intense mint
and chocolate products.
Reported operating revenues increased $64 million (24.2%) over
1999, due primarily to higher volume/mix. Reported operating
companies income increased $27 million (37.0%) over 1999, due
primarily to higher volume/mix ($45 million) and the 1999 separation
charge, partially offset by higher marketing, administration and
research costs ($24 million). On an underlying basis, operating
companies income increased 36.5%.
Beverages, Desserts and Cereals: Reported volume in 2000
increased 8.1% from 1999. Beverages volume grew on the strength
of ready-to-drink beverages, reflecting new product introductions,
and higher coffee shipments due to growth in Starbucks grocery
coffee. Volume also grew in frozen whipped toppings, due in part
to the introduction of new products. These increases were partially
offset by lower volume in ready-to-eat cereals, due to aggressive
competitive activity, and lower volume in dry packaged desserts,
reflecting lower promotions. On an underlying basis, volume
increased 9.5%, of which 0.6 percentage points related to the
acquisition of Balance Bar Co.
Reported operating revenues increased $192 million (3.8%) over
1999, due primarily to higher volume/mix ($126 million) and the
acquisition of Balance Bar Co. ($113 million), partially offset by the
shift in CDC revenues ($44 million).
Reported operating companies income increased $81 million (8.0%)
over 1999, due primarily to higher volume/mix ($50 million), the
1999 separation charges ($46 million), higher margins ($20 million,
due primarily to lower commodity costs) and the acquisition of
Balance Bar Co., partially offset by higher marketing, administration
and research costs ($29 million, the majority of which related to
higher marketing expenses), and the shift in CDC income ($14
million). On an underlying basis, operating companies income
increased 4.7%.
Oscar Mayer and Pizza: Reported volume in 2000 increased
5.2% from 1999. Volume grew in pizza, reflecting the continued
success of rising crust pizza and new product introductions.
Volume growth also reflected the introduction of new lunch
combination varieties, the acquisition of Boca Burger, Inc. and
gains in hot dogs and cold cuts. On an underlying basis, volume
increased 5.9%, of which approximately 0.8 percentage points
related to the acquisition of Boca Burger, Inc.
Reported operating revenues increased $263 million (8.2%) over
1999, due primarily to higher volume/mix ($168 million), higher
pricing ($82 million) and the acquisition of Boca Burger, Inc. ($35
million), partially offset by the shift in CDC revenues ($24 million).
Reported operating companies income increased $62 million
(13.8%) over 1999, due primarily to higher volume/mix ($78 million),
higher margins ($43 million) and the 1999 separation charge ($38
million), partially offset by higher marketing, administration and
research costs ($86 million, the majority of which related to higher
marketing expenses) and the shift in CDC income ($8 million). On
an underlying basis, operating companies income increased 6.6%.
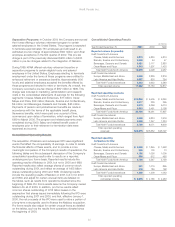
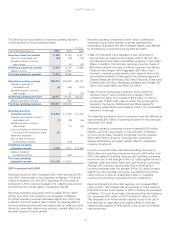
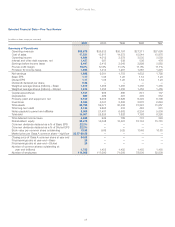
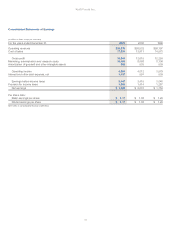
Kraft Foods International
(in millions)
Year Ended December 31, 2001 2000 1999
Reported volume (in pounds):
Europe, Middle East and Africa 2,826 2,829 2,816
Latin America and Asia Pacific 2,057 803 764
Total reported volume (in pounds) 4,883 3,632 3,580
Volume of businesses sold:
Europe, Middle East and Africa (1) (40) (93)
Latin America and Asia Pacific (17) (37) (70)
Estimated impact of century
date change:
Europe, Middle East and Africa 7(7)
Latin America and Asia Pacific 7(7)
Underlying volume (in pounds) 4,865 3,569 3,403
Nabisco volume:
Europe, Middle East and Africa 44
Latin America and Asia Pacific 1,089
Pro forma volume (in pounds) 4,865 4,702
Reported operating revenues:
Europe, Middle East and Africa $6,339 $6,824 $7,676
Latin America and Asia Pacific 2,430 1,247 1,224
Total reported operating revenues 8,769 8,071 8,900
Operating revenues of
businesses sold:
Europe, Middle East and Africa (131) (294)
Latin America and Asia Pacific (4) (21) (54)
Estimated impact of century
date change:
Europe, Middle East and Africa 14 (14)
Latin America and Asia Pacific 12 (12)
Underlying operating revenues 8,765 7,945 $8,526
Nabisco operating revenues:
Europe, Middle East and Africa 47
Latin America and Asia Pacific 1,140
Pro forma operating revenues $8,765 $9,132