Kraft 2001 Annual Report Download - page 32
Download and view the complete annual report
Please find page 32 of the 2001 Kraft annual report below. You can navigate through the pages in the report by either clicking on the pages listed below, or by using the keyword search tool below to find specific information within the annual report.
Kraft Foods Inc.
26
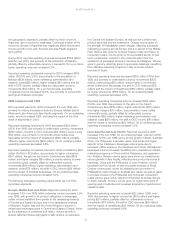
Reported operating companies income, which is defined as
operating income before general corporate expenses and
amortization of goodwill and other intangible assets, was affected
by the following unusual items during 2001 and 2000:
• Sale of Food Factory and Integration Costs: During 2001,
the Company recorded pre-tax charges of $53 million for site
reconfigurations and other consolidation programs in the United
States. In addition, the Company recorded a pre-tax charge of
$29 million related to the sale of a North American food factory.
These pre-tax charges, which aggregate $82 million, were
included in marketing, administration and research costs in the
consolidated statement of earnings for the following segments:
Cheese, Meals and Enhancers, $63 million; Biscuits, Snacks and
Confectionery, $2 million; Beverages, Desserts and Cereals, $12
million; and Oscar Mayer and Pizza, $5 million.
• Sale of French Confectionery Business: During 2000, the
Company sold a French confectionery business (“French
Confectionery Sale”) for proceeds of $251 million on which a
pre-tax gain of $139 million was recorded. The pre-tax gain is
included in the Europe, Middle East and Africa segment’s
marketing, administration and research costs in the consolidated
statement of earnings.
The operating companies income comparison was also affected by
approximately $40 million of operating income from the previously
mentioned CDC sales.
Reported operating companies income increased $1,280 million
(26.9%) over 2000, due primarily to the acquisition of Nabisco.
On a pro forma basis, operating companies income increased
$500 million (8.9%), driven by volume growth, productivity
savings and Nabisco synergies, partially offset by unfavorable
currency movements.
Currency movements have decreased operating revenues by
$522 million and operating companies income by $60 million from
2000. Decreases in operating revenues and operating companies
income are due to the strength of the U.S. dollar against the euro,
Canadian dollar and certain Asian and Latin American currencies.
Although the Company cannot predict future movements in
currency exchange rates, the strength of the U.S. dollar, primarily
against the euro and Asian currencies, if sustained during 2002,
could continue to have an unfavorable impact on operating
revenues and operating companies income comparisons.
Reported interest and other debt expense, net, increased $840
million in 2001. This increase was due primarily to notes issued to
Philip Morris in the fourth quarter of 2000 to finance the acquisition
of Nabisco. On a pro forma basis, interest and other debt expense,
net, decreased $213 million in 2001 from $1,348 million in 2000.
This decrease in pro forma interest expense is due to the use of
free cash flow to repay debt and ongoing efforts to externally
refinance debt payable to Philip Morris in the current low interest
rate environment.
The following is a reconciliation of reported operating results to
underlying and pro forma operating results:
(in millions)
Year Ended December 31, 2001 2000 1999
Reported volume (in pounds) 17,392 13,130 12,817
Volume of businesses sold (18) (82) (176)
Estimated impact of century
date change 55 (55)
Underlying volume (in pounds) 17,374 13,103 12,586
Nabisco volume 3,852
Pro forma volume (in pounds) 17,374 16,955
Reported operating revenues $33,875 $26,532 $26,797
Operating revenues of
businesses sold (4) (162) (373)
Estimated impact of century
date change 97 (97)
Underlying operating revenues 33,871 26,467 $26,327
Nabisco operating revenues 7,566
Pro forma operating revenues $33,871 $34,033
Reported operating
companies income $ 6,035 $ 4,755 $ 4,253
Operating companies income of
businesses sold (1) (39) (64)
Estimated impact of century
date change 40 (40)
Loss on the sale of a North American
food factory and integration costs 82
Separation programs 157
Gain on sale of a French
confectionery business (139)
Underlying operating
companies income 6,116 4,617 $ 4,306
Nabisco operating
companies income 999
Pro forma operating
companies income $ 6,116 $ 5,616
2001 compared with 2000
Reported volume for 2001 increased 4,262 million pounds (32.5%)
over 2000, due primarily to the acquisition of Nabisco. Pro forma
volume increased 2.5% over 2000. Excluding the 53rd week of
shipments in 2000, volume increased 3.7%, reflecting new product
introductions and volume gains in developing markets.
Reported operating revenues for 2001 increased $7,343 million
(27.7%) over 2000, due primarily to the acquisition of Nabisco.
Pro forma operating revenues decreased slightly from 2000, due
primarily to the 53rd week of sales in 2000, the adverse effect of
currency exchange rates and lower sales prices on coffee products
(driven by commodity-related price declines), partially offset by the
favorable impact of volume growth.


